Shifter Crash Course Refresher
If you are reading this page, you should have received shift training from an expert already. Also, if you are reading this page, please familiarise yourself with the more detailed information in the “Shifter Information” section. This page is written as a reminder and overview. If you have further comments on how this can be improved, please let Colton/Max/Ryo know.
Basics
Shifting Basics:
Each shift is 1 week.
The shift starts on Monday following the Shift Handover Meeting.
The Shift Handover Meeting starts each Monday at 11:00 Tokyo-time (unless stated otherwise).
Active shift times are from ~09:00 to ~18:00.
Supplemental shift times are once in the morning, and in the evening.
Experts will also be monitoring the situation - talk to them!
Restarting the DAQ
This will be a commonly requested action. Enter the screen session “master” on icehap-daq (if you need further information look below). In most cases it will be sufficient to press the UP arrow on your keyboard, and hit enter. The full walk-through to start a new run is:
<local machine> ssh icehap-daq
<icehap-daq> screen -r master
<master screen> cd /home/icehap-daq/software/degg_measurements/degg_measurements/daq_scripts/
<master screen> python3 fat_master.py configs/fat_I_00XYZ.ini
If the run is already in progress the last command will be modifed as seen below:
<master screen> python3 fat_master.py configs/fat_I_00XYZ.ini --recover --force
Rebooting the D-Eggs
The D-Eggs have domnet (comm software) running in a screen session on icehap-daq. Except in rare circumstances, it is not requried for a shifter to restart. If you are unsure, contact the expert.
<local machine> ssh icehap-daq
<icehap-daq> screen -r setup
<setup screen> control+c <---- this kills the communications!
<setup screen> python3 setup_deggs.py
<setup_deggs prompts> y
<setup_deggs prompts> y
----> Check that all wirepairs are responsive (16/16) <----
----> If no, control+c and try again. <----
----> Otherwise continue... <----
<setup_deggs prompts> y
<setup_deggs prompts> y
----> Wait for FPGAs to flash, check for 16/16 <----
----> If no, control+c and try again. <----
----> Otherwise continue... <----
<setup_deggs prompts> y
----> Check tabletop mainboard, it will retry automatically <----
<setup screen> control+a, d
Measurement Crash Course
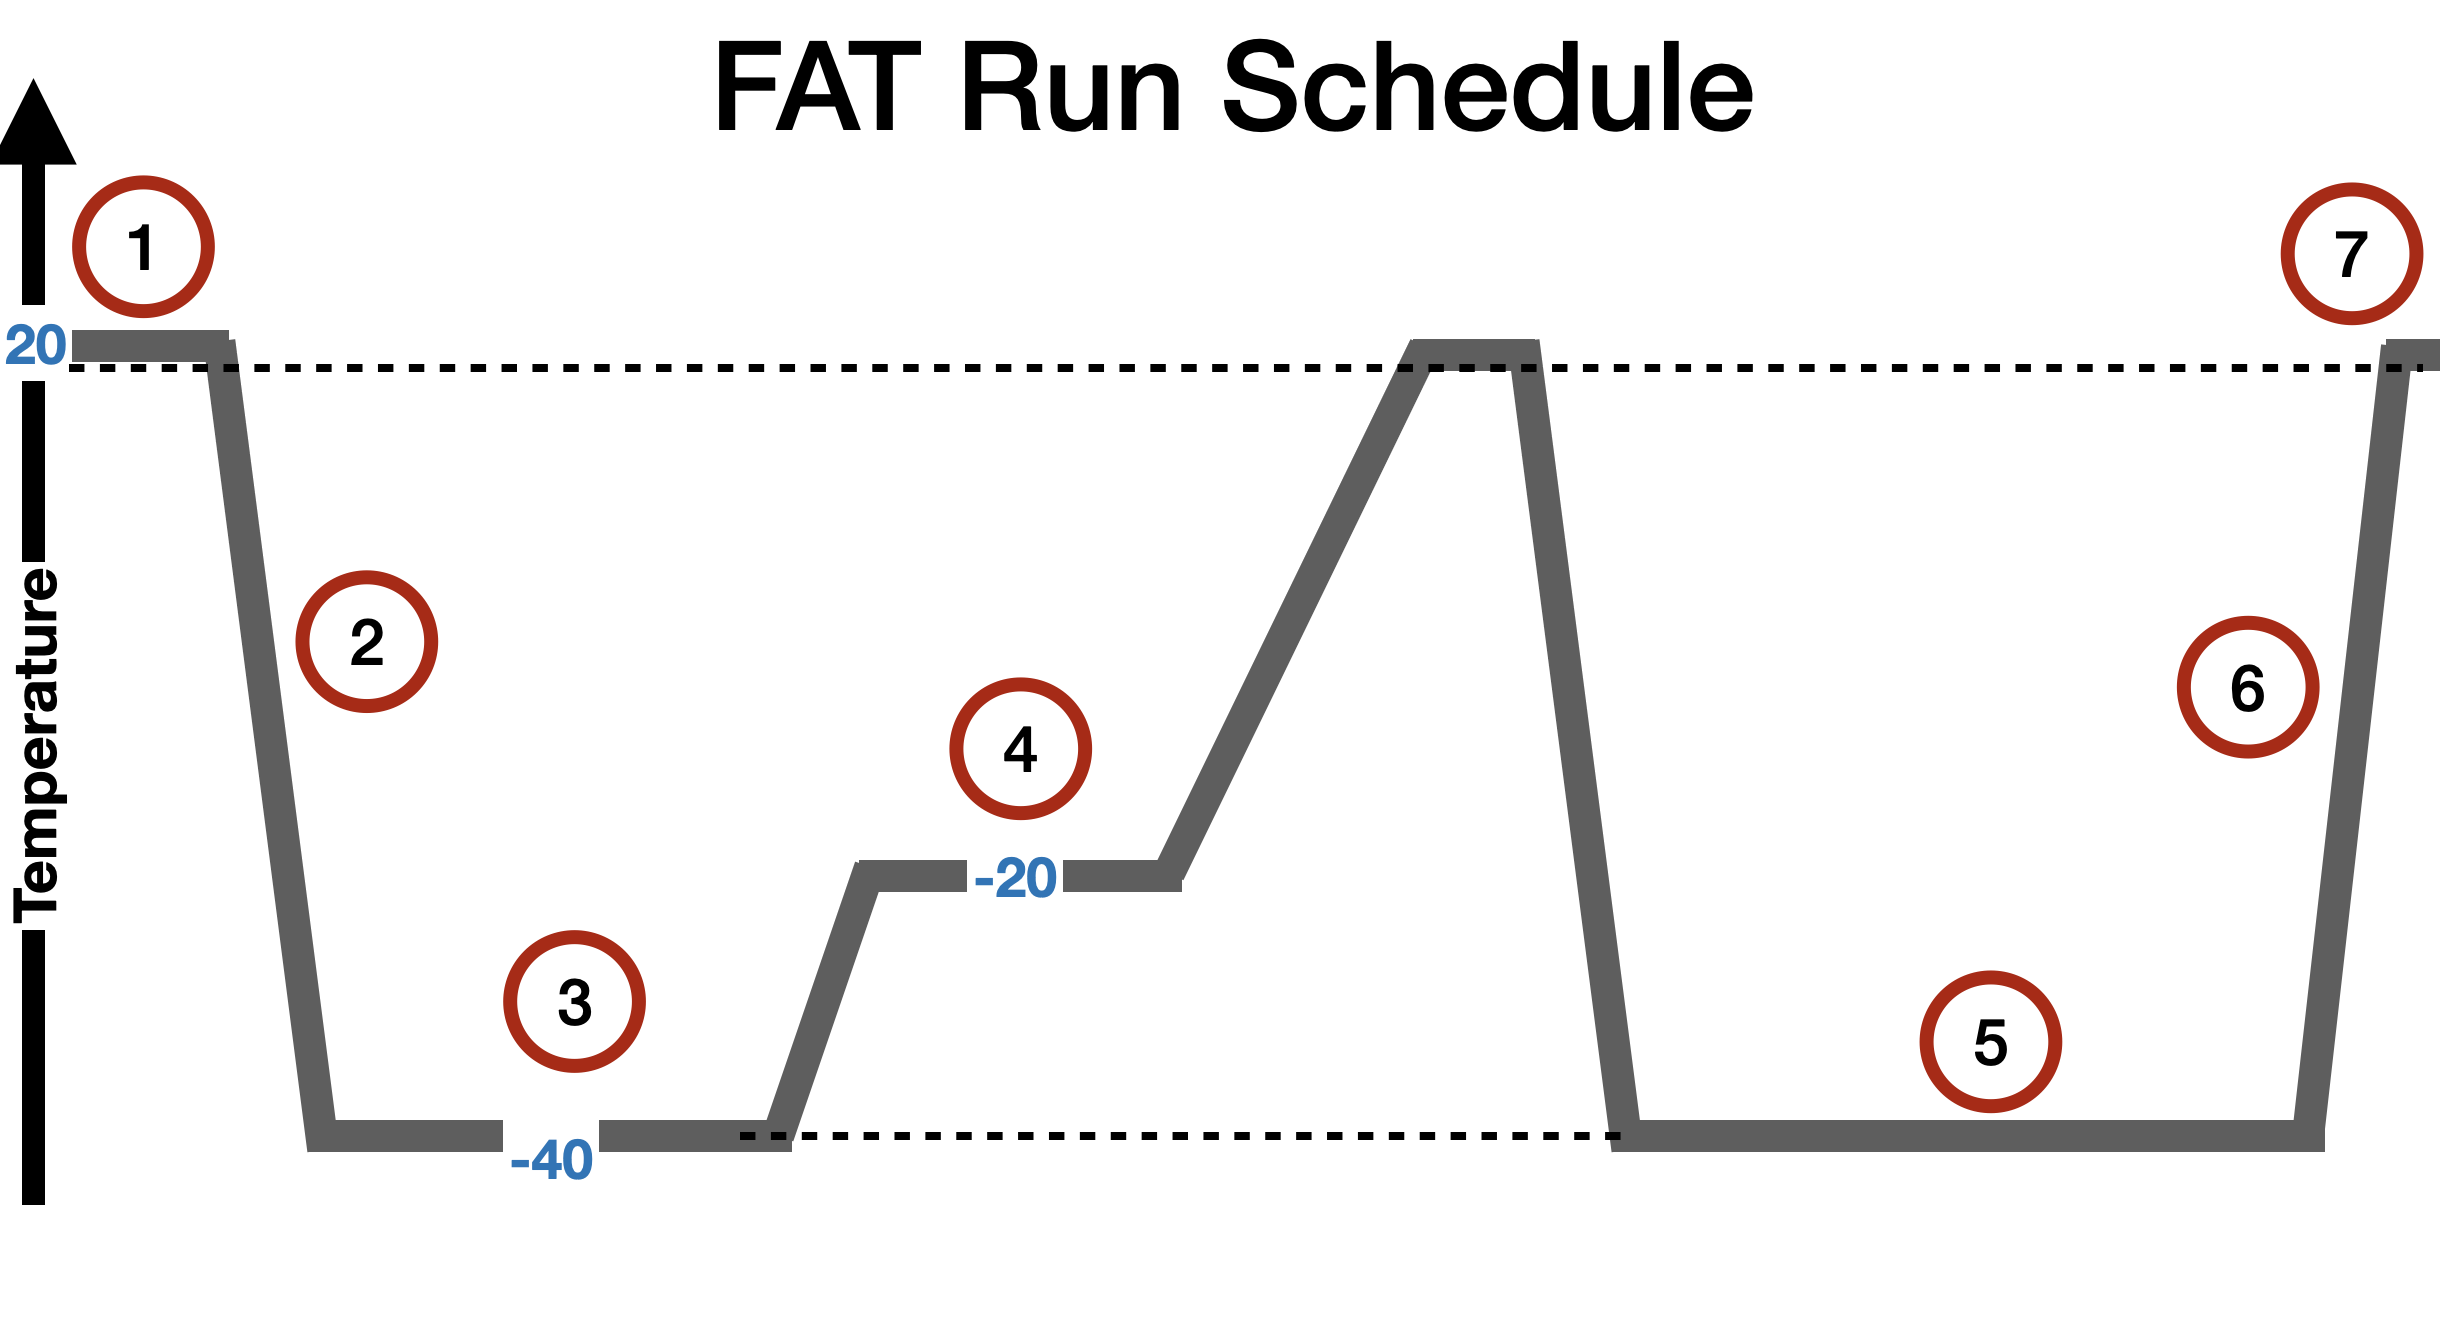
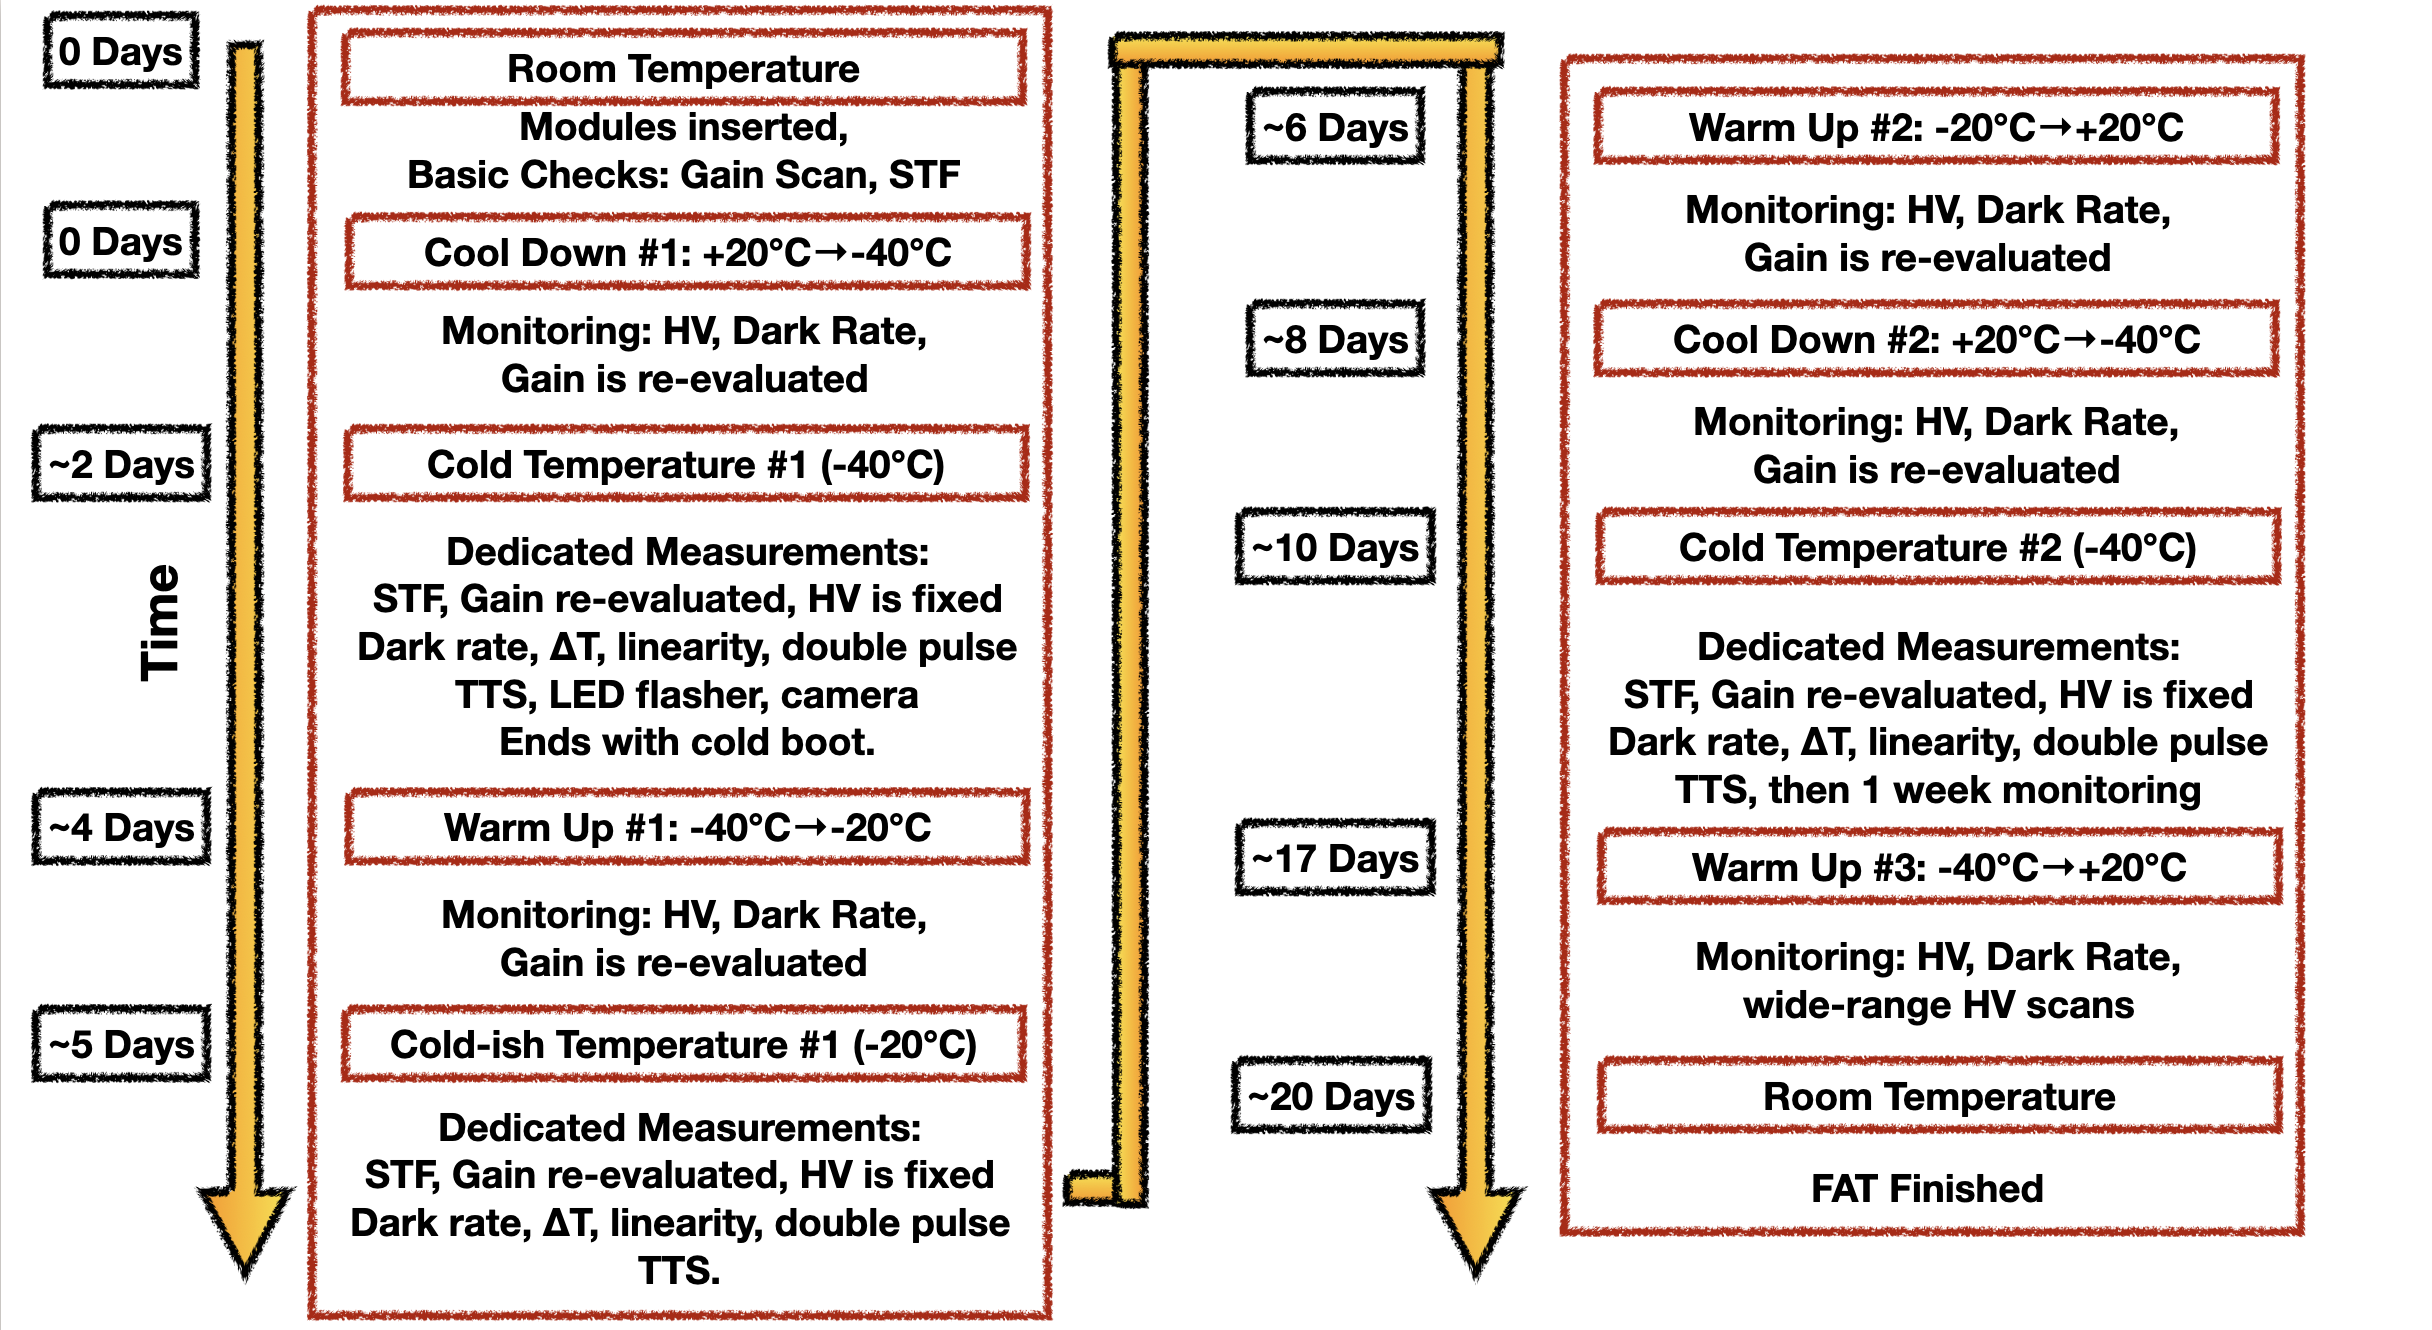
The two graphics shown here give some general overview of the FAT procedure and testing schedule. Based on the D-Egg thermometers, you can infer which section of the FAT we’re in. D-Egg thermometer measurements are ouptut to Slack frequently (with every monitoring measurement).
A D-Egg temperature of +20 or greater corresponds to room temperature (freezer is off). A D-Egg temperature of ~0 corresponds to -20 freezer temperature. A D-Egg temperature of around -20 corresponds to -40 freezer temperature.

Loading, room temperature checks (laser visiblity, gain, stf).
Monitoring, gain is re-evaluated as temperature changes.
3. Gain is again re-evaluated once modules reach constant temperature. Further dedicated measurements are performed. The freezer temperature is set to -40 with about +/- 2 degree variations. Camera and cold boot are also performed during this time.
4. Same as point 3, but now at -20 degrees. No measurements of cameras or cold boot.
5. Extended cold period where we can track gain stability. Measurements are repeated from point 3.
Monitoring is replaced with regular evaluation of the high voltage to scan over the temperature vs HV 2D phase space.

Computing Crash Course
For D-Egg FAT, there are 3 relevant computing sites:
grappa - the Chiba cluster, mainly analyses run here.
icehap-daq / fat pc - the machine where the DAQ runs.
madison - for the database and storage
grappa
Data is copied periodically from the DAQ machine to grappa for analysis. You will need to be able to access this machine to perform the duties of a shifter. If you do not already know how to access grappa, please contact an expert.
Note about environments and permissions: Consider performing a round-trip to configure the permissions easily. See blow for information on logging in to icehap-daq.
<my-pc> ssh grappa
<grappa> ssh icehap-daq@10.25.121.183
<ICEHAP password>
<icehap-daq> ssh grappa
Now you will be on grappa as the fat user, with the degg-fat software environment already loaded.
Software on grappa is available from:
analysis: /disk20/fat/software/degg_measurements/degg_measurements/analysis
raw data: /disk20/fat/data
icehap-daq
The ‘icehap-daq’ machine, also known as the ‘fat pc’ is where the DAQ runs. Note: in other locations/commands this may also be abbreviated as ‘fvt’. Connection to this PC is directly possible from inside the university network. Otherwise access via grappa.
<my-pc> ssh grappa
<grappa> ssh icehap-daq@10.25.121.183
Input the ICEHAP lab password. Software on grappa is available from:
analysis: /home/icehap-daq/software/degg_measurements/degg_measurements/analysis
raw data: /home/icehap-daq/data
The screen session where the DAQ is running is called master. Attach to the screen session using screen -r master. To de-attach hit control+a and then d. See later sections for more tips, or consult the screen documentation.
Daily & Weekly Responsibilities
This section attempts to outline requested actions from each shifter in detail. Please consider this to be a suggested timeline and not a strict requirement. If you see any problems or anything you do not understand, contact an expert. In most cases you should also make a post in https://docs.google.com/forms/d/e/1FAIpQLSdnE5WSwlDC54obE5TANehFE_zxtDWXxQXUcKFD_wLt4QiXFg/viewform?usp=share_link.
If you populate your weekly report as the week goes along, this will make it easier at the end.
DAQ
Check the DAQ at least every hour (during working hours). You can view the DAQ status directly from the master screen session on the icehap-daq machine. Or remotely any time on the chiba-daq slack channel.
If the DAQ is stuck, slack will not update. The slack channel should not substitute checking the screen session. If the DAQ is stuck or has crashed, see the sections below (I’m seeing errors, what do I do?, The DAQ didn’t post an update for a long time, what do I do?)
Monitoring Plots
Check the monitoring plots at least once per day.
Monitoring plots are located on grappa. See the section - Grappa: monitoring below. If you do not see any newly updated plots for more than 1 day, notify an expert!
New Analysis Plots
Check the newly created analysis plots at least once per day. Most analysis will publish the plots or at least the directory to slack. To check which analyses have been run, look at the time stamp of the log files:
<grappa> ls -ltr /disk20/fat/data/logs
Analysis plots are located under: <grappa> /disk20/fat/software/degg_measurements/degg_measurements/analysis/. See below for the specific analysis plot locations.
How to detect errors
While we have a number of automated warnings, we cannot catch everything. Places to find errors/warnings:
Slack: degg_fat
The channel for communicating with the shifters and experts. Post plots, questions, warnings here. No automatic posts go here. Experts may make suggestions on something to check here.
Slack: chiba-daq
The channel for remote reporting, exclusively automated posts. If an error is caught by the DAQ or analysis scripts, posts will go here. Many analysis scripts will send plots here automatically, or give a path to check. Do not write posts here.
Icehap-daq: master
The master screen session (on the icehap-daq) is where the DAQ runs. As discussed above, this should be checked regularly. The error reported in the screen session will be the same as that reported to slack.
Grappa: analysis overview
As the icecube user (in the degg-fat environment), check the screen sessions (screen -ls). If there are many screens open, it might indicate that an analysis got stuck. If there was a failure in an analysis, it can be found in the log:
<grappa> ls -ltr /disk20/fat/data/logs
then open the latest log.
Grappa: monitoring
As discussed above, this directory should be checked regularly. The chiba-daq output will often output: /misc/disk20/fat/software/degg_measurements/degg_measurements/analysis/monitoring/fig/run_00XYZ, where XYZ is the current run number. When this is the case, consider checking these plots. Start with the comparison_*.pdf, to quickly search for any outliers.
Grappa: specific analyses
These plots will all be in the base path: /disk20/fat/software/degg_measurements/degg_measurements/analysis/. Relevant folders where analysis plots should be generated include:
gain/figs/run_XYZ
darkrate/figs/XYZ_DarkrateScalerMeasurement_*/
darkrate/figs_dt/XYZ_DeltaTMeasurement_*/
double_pulse/figs/XYZ_DoublePulse_*/
flasher_chargestamp/plots/00XYZ/
linearity/figs/run_00XYZ_linearity_*/
tts/figs/XYZ_*/
where the * indicates the measurement sub-number. Each analysis may be run multiple times for the same FAT run, during your shift make sure to check the latest.
The DAQ didn’t post an update for a long time, what do I do?
Occasionally the DAQ can get stuck. This appears to be due to some iceboot sockets not closing properly. As the shifter, this should be able to be identified by opening the master screen session.
If you see this happening:
kill the DAQ (control+c)
Write a message (‘daq was stuck’)
Hit Enter
Wait for the script to exit
Re-start the DAQ (see above)
I’m seeing errors, what do I do?
This section gives a short overview of some errors which occur and have known solutions.
Dark Rate is over 4000 Hz
Consult the monitoring plots for this PMT (see above). If this module shows a trend of values above 4000 Hz, fill out the shifter form.
Exception: Unknown waveform version
This occurs when communication breaksdown between the D-Egg and mini-fieldhub. The solution is to re-start the DAQ (see above).
Disk Space is below 50 GB
Inform the expert/on-call shifter.
Analysis Error
Analysis errors can be seen either by consulting the logs, or slack (chiba-daq). You can see this is an analysis error because it will say ex. “detailed_monitoring-Analysis”. Contact the expert/on-call shifter.
SPE Peak Position Error
The SPE peak position is checked during gain scans. ex. “Gain Check for SQ0835: SPE peak position is 1.28, which is far away from the expected peak position of 1.6!”. This indicates a possible issue with the PMT’s gain. Consult the latest gain curve for the relevant PMT (see gain plots location above).
Cold Boot Error
The cold boot is performed once per FAT cycle. If there are problems, the DAQ will automatically exit with something like: “Problems during Cold Boot (Retry = 2) - 4 modules are invalid!”.
If you see this, contact an expert immediately. The current procedure is to manually verify if the cold boot was successful. This involves running the setup procedure (see above or other pages for more detail). Shifters are not required to re-run setup, but CAN do so if they wish.
Assuming all modules recover from the cold boot, procedure involves:
<local machine> ssh icehap-daq
<icehap-daq> cd data/json/run/
<icehap-daq> vim run_00XYZ.json
Go to the bottom of the file, and find the last coldboot entry.
Change the “0” to a “1”.
Save and close the file.
Restart the DAQ.
Other Errors
An error which was not listed here has occured! Contact the expert and they will give advice on what to do.