- QE337nm
PMT QE at 337nm. By default it should be Chiba measurement value. - QE(sim-data)[%]
mean of difference from GDOM Efficiency (data) AFTER compensation - fig
The histogram of QE(sim-data)[%]. - shift x[nm]
Shifted length of Wavelength Acceptance (of glass+gel) x-axis (wavelength axis)->corresponds uncertainty of transparency
| PMTName | QE337nm | Before Compensation | Compensation Mode | After Compensation | ||
|---|---|---|---|---|---|---|
| sim-data[%] | fig | shift x[nm] | sim-data[%] | fig | ||
| TA1052 | 0.2459 | 4.31 | [diff] [0~168deg] [180~348deg] | -10.0 | 0.09856 | [diff] [0~168deg] [180~348deg] |
| TA1059 | 0.2396 | 4.7 | [diff] [0~168deg] [180~348deg] | -10.0 | 0.7882 | [diff] [0~168deg] [180~348deg] |
| TA1062 | 0.2402 | 2.54 | [diff] [0~168deg] [180~348deg] | -6.5 | 0.0859 | [diff] [0~168deg] [180~348deg] |
| TA1069 | 0.2383 | 3.431 | [diff] [0~168deg] [180~348deg] | -8.5 | 0.1711 | [diff] [0~168deg] [180~348deg] |
| TA1167 | 0.2254 | 3.475 | [diff] [0~168deg] [180~348deg] | -9 | 0.1057 | [diff] [0~168deg] [180~348deg] |
DOM 2D Map Subtraction
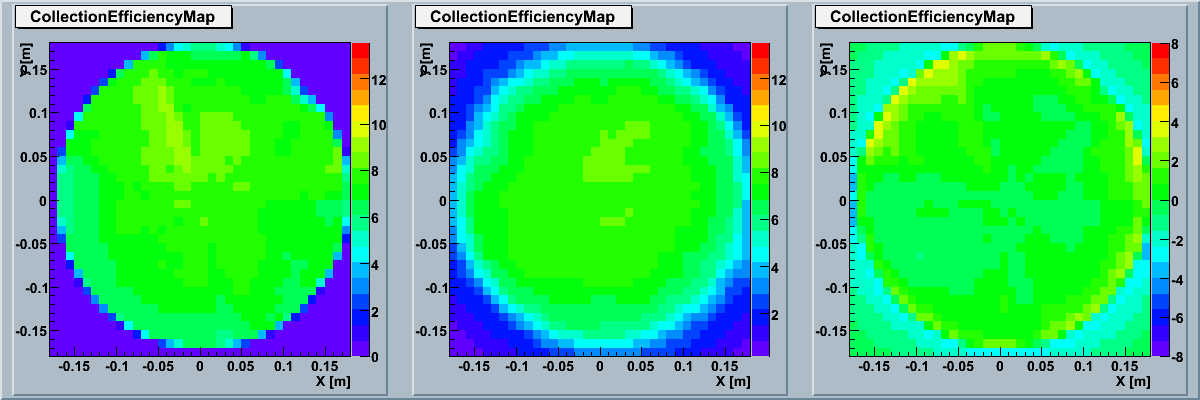
We subtracted real DOM 2D Map from simulated DOM 2D Map.
The left three figures are the case before compensation and the right three figures are the case after compensation.
TA1052
| 337nm | 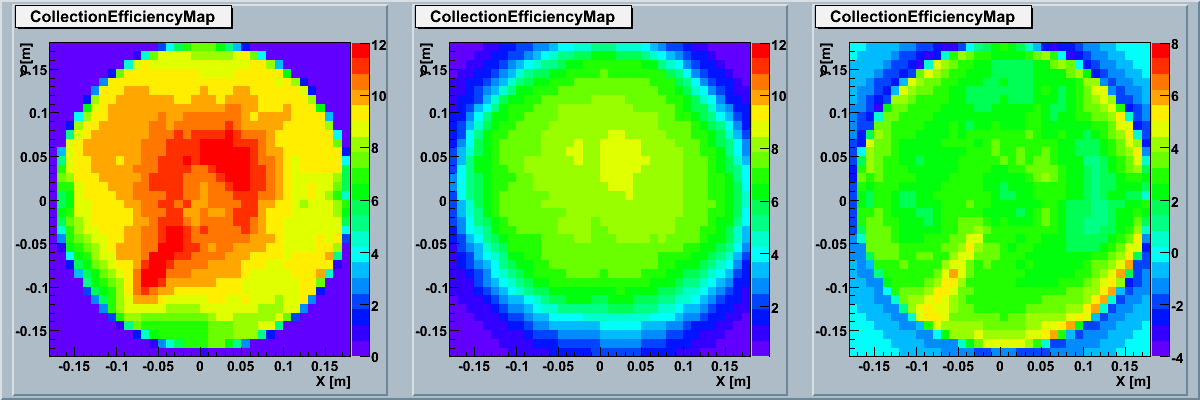 |
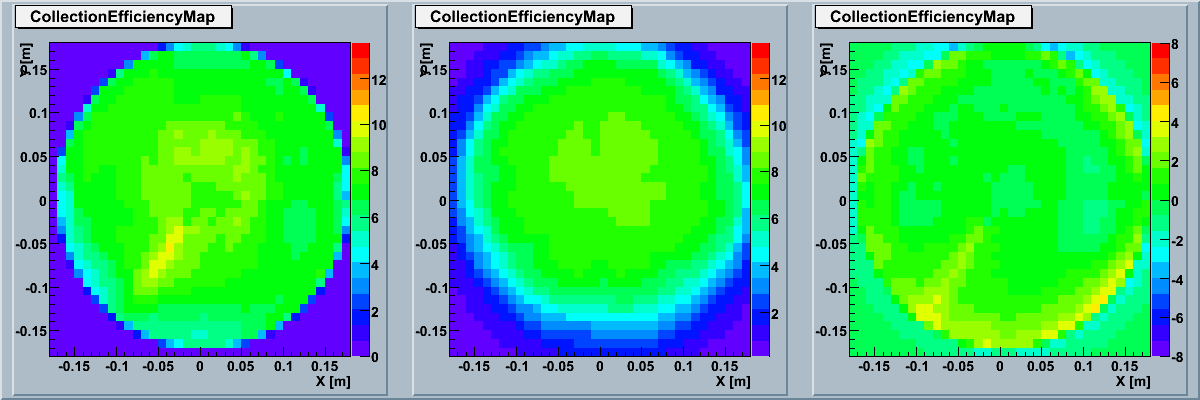 |
TA1059
| 337nm | 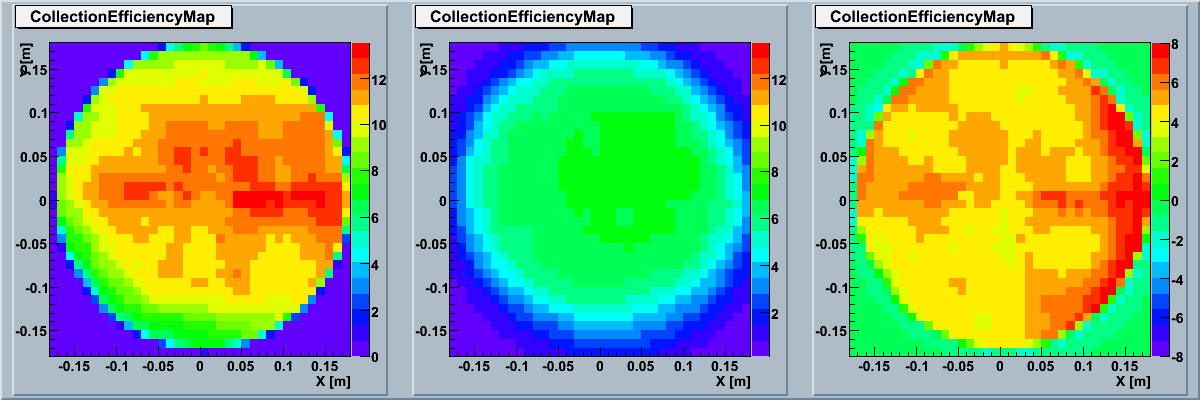 |
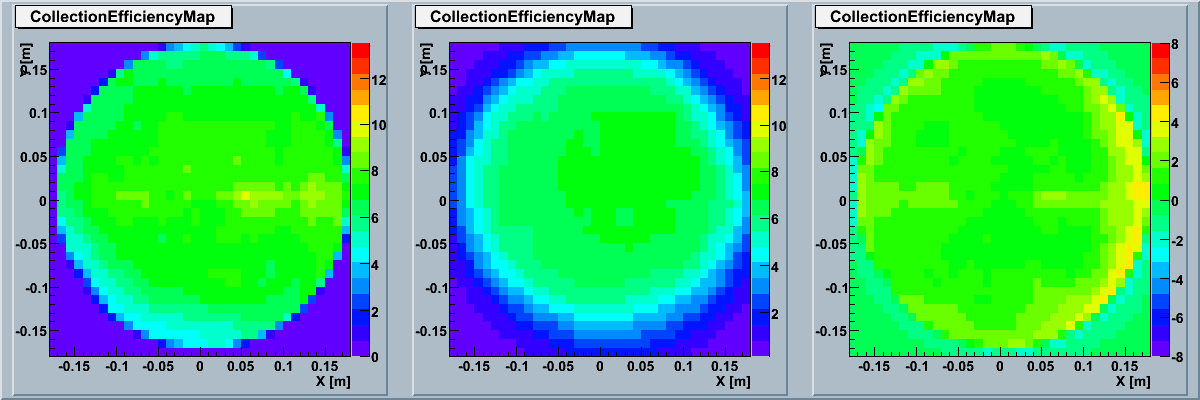 |
TA1062
| 337nm | 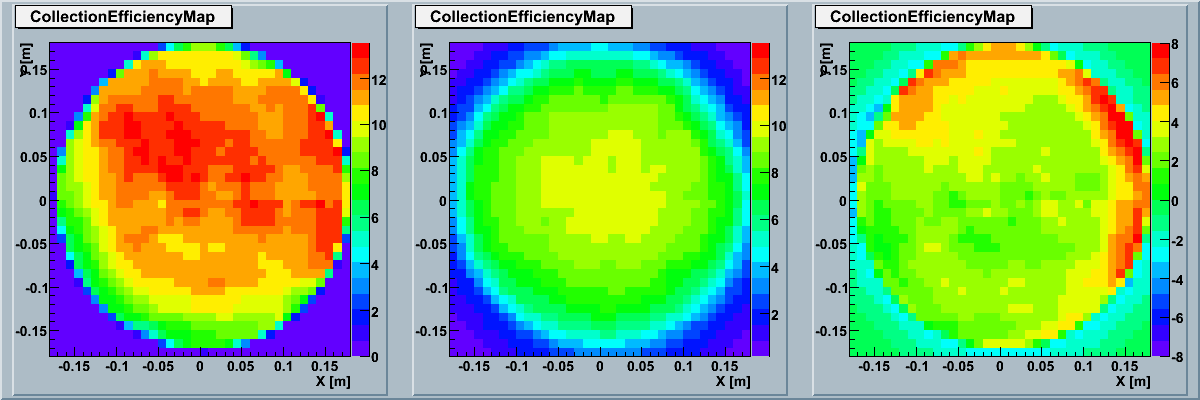 |
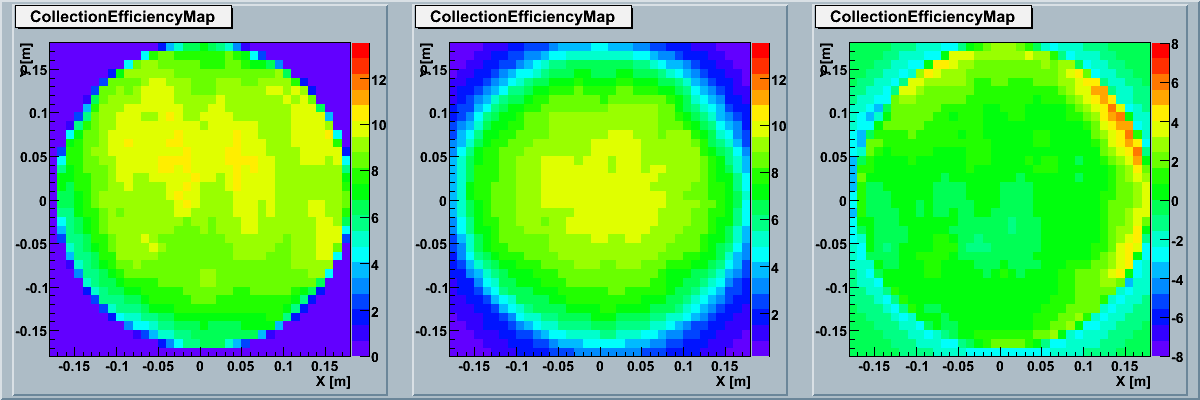 |
TA1069
| 337nm | 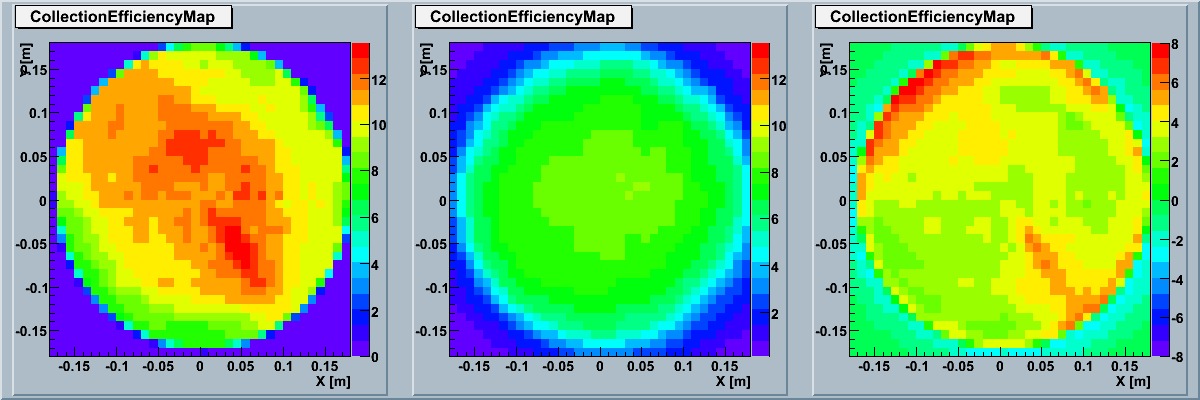 |
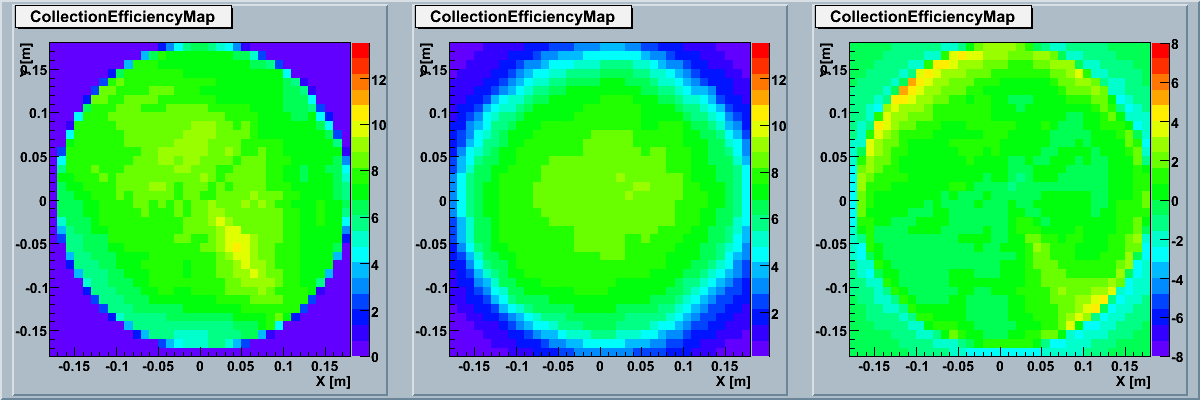 |
TA1167
| 337nm | 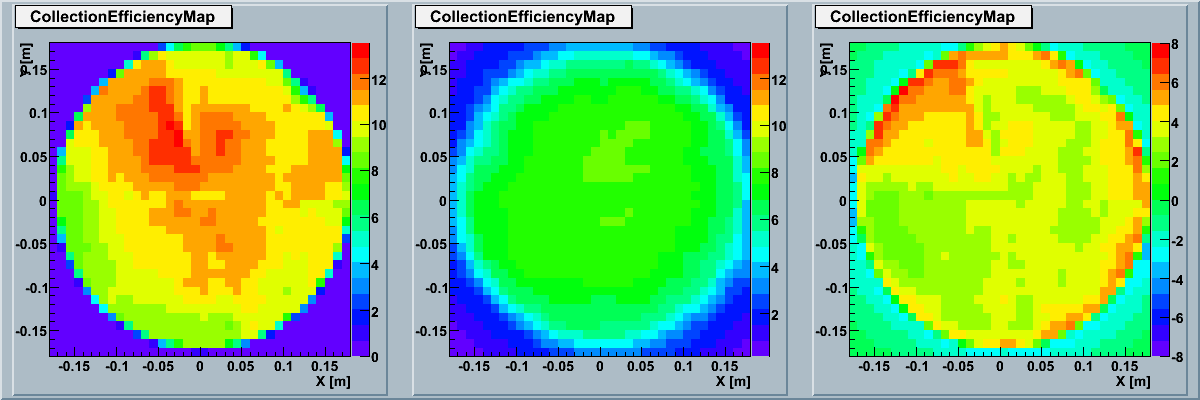 |
 |