This is the second trial for the EHE reconstruction.
We use the waveform-based log-likelihood as usual.
I use the K-function for reconstruction. (See here.)
This time, I forcused on the energy reconstruction.
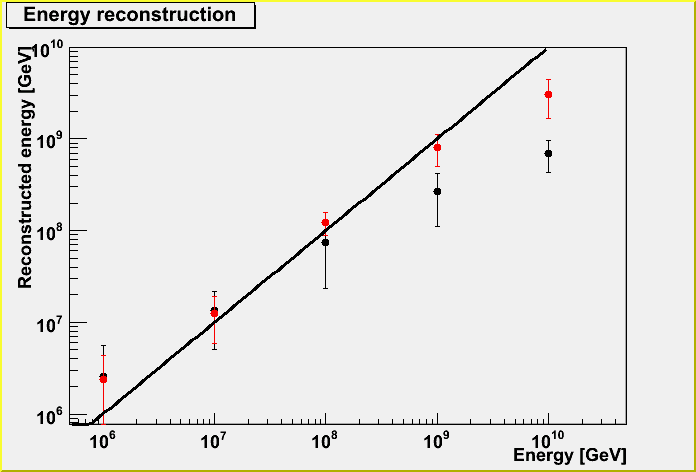
At first, I tried the reconstruction with monochromatic energy MC data files (based on icesim V01-09-06a). The geometry is also fixed. A muon runs horizontally, passing through the center of the detector.
I didn't use saturated OMs for the reconstruction. I also use the true geometry for the seed for this trial.
Red: FADC
Black: ATWD

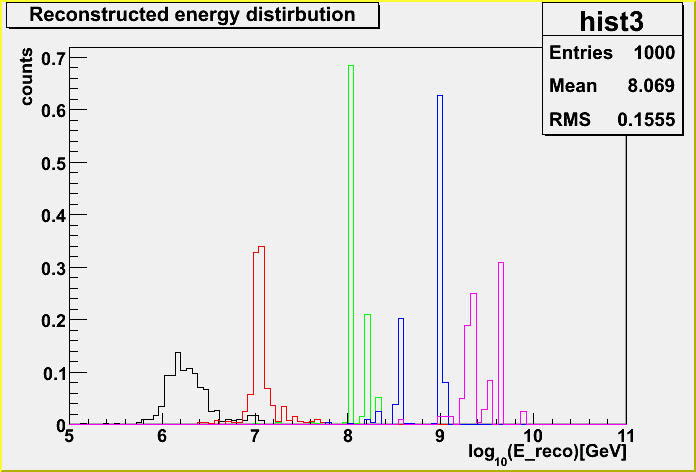
I plotted the reconstructed energy distributions below for each true energy.
black: 10^6 GeV, red: 10^7 GeV, Green: 10^8 GeV, blue: 10^9 GeV, pink: 10^10 GeV
The distributions are normalized to unity, but the event number are actually different. (1000 events for 10^6 GeV, 200 events for 10^10 GeV)
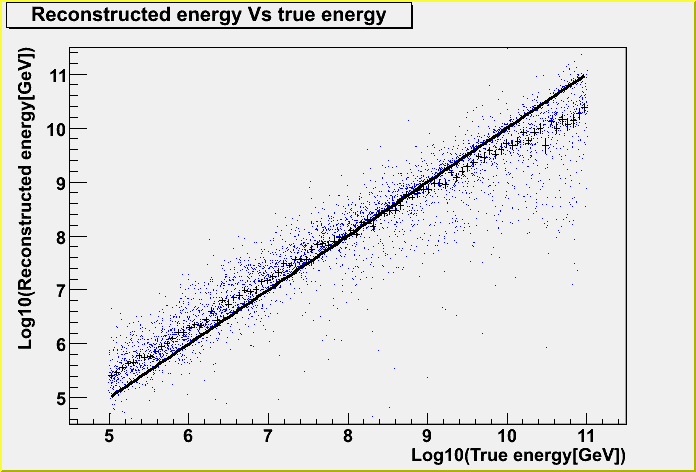
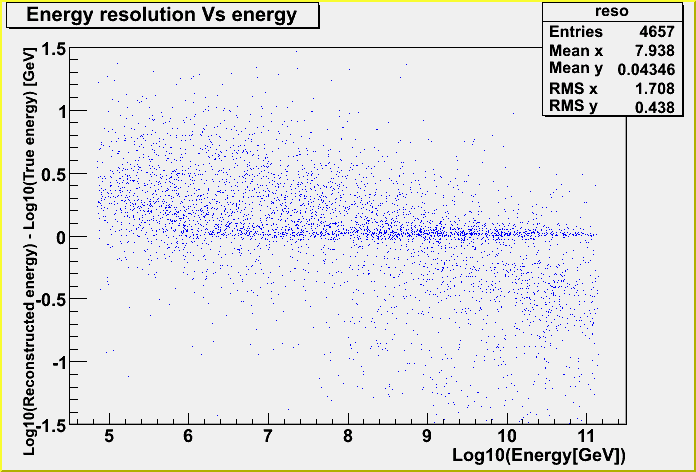
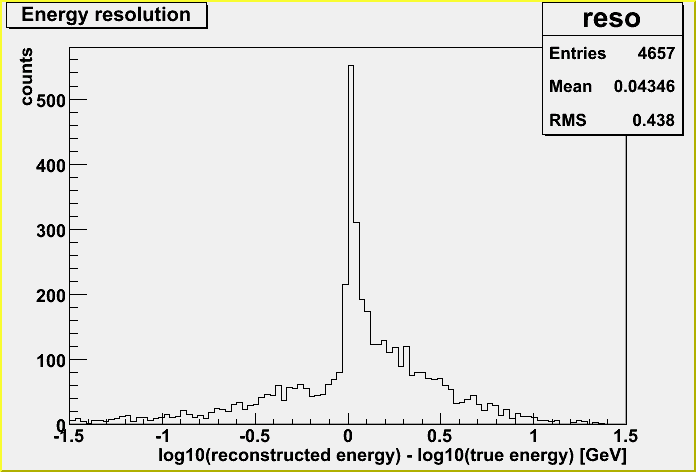
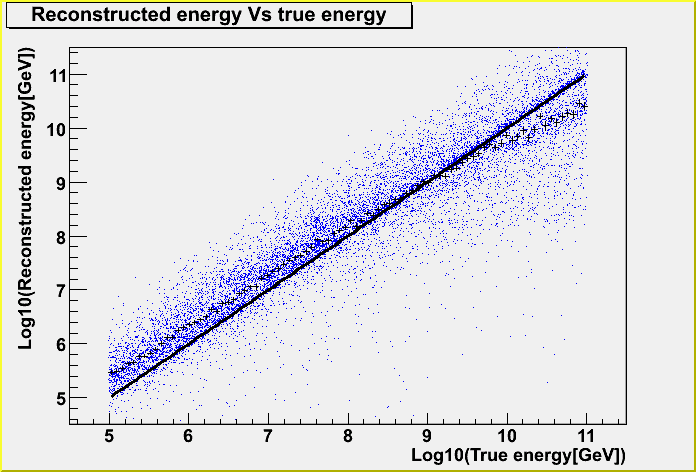
I have reconstructed juliet full MC files (based on icesim V01-09-06a). The energy follows the differential spectrum index of -1 (dN/dE = E^-1, dN/dlogE = const.), and the geometry is fully random.
I used FADC pulses for this energy reco.
The reconstructed enregy Vs true energy
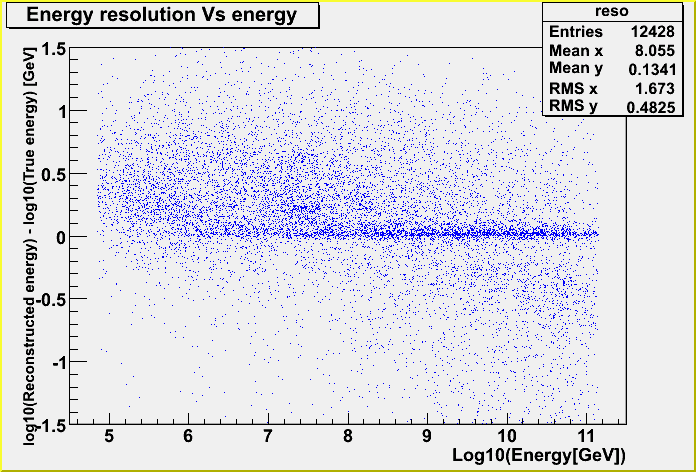
The enregy resolution Vs true energy
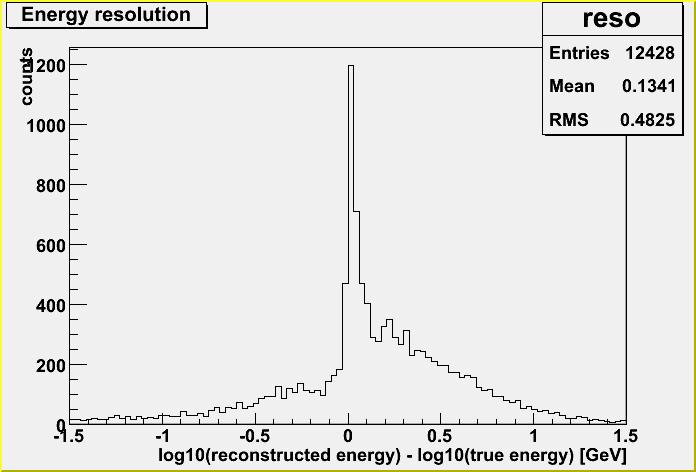
The enregy resolution histogram
There is some tail....
I thought the long tail comes from a track far away from the center of the detector, but there is not so much distance dependence than I expected.
There is blobs at 700m, which I don't understand.
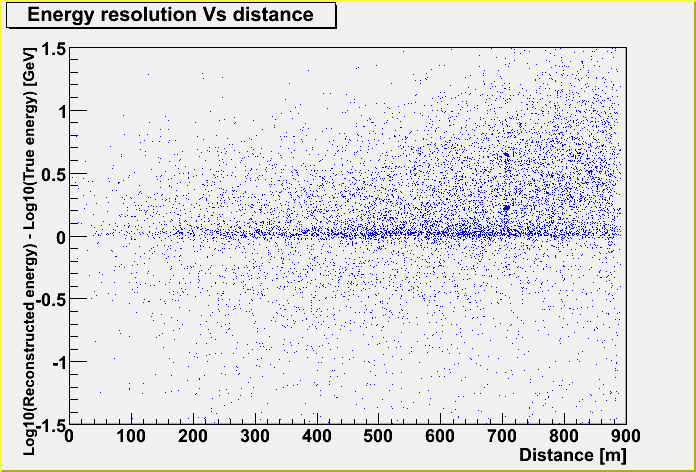
Anyway, with distance cut (dist<600m). This doesn't seeem to improve results so much...
