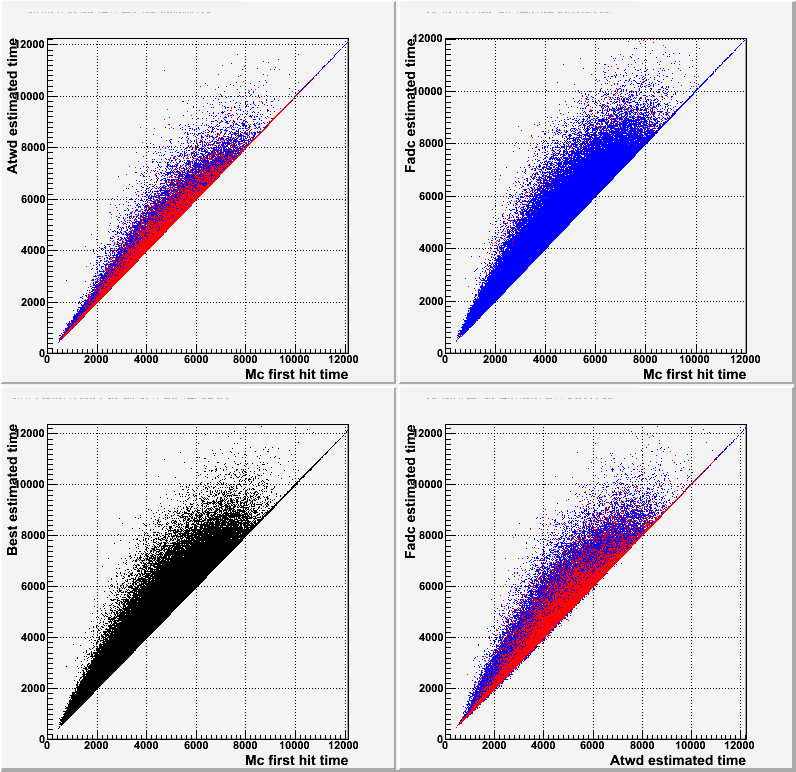
Portia t10 (10% rise time) Vs MC first hit time
Blue: case of fADC recording larger charge. Red: ATWD larger.
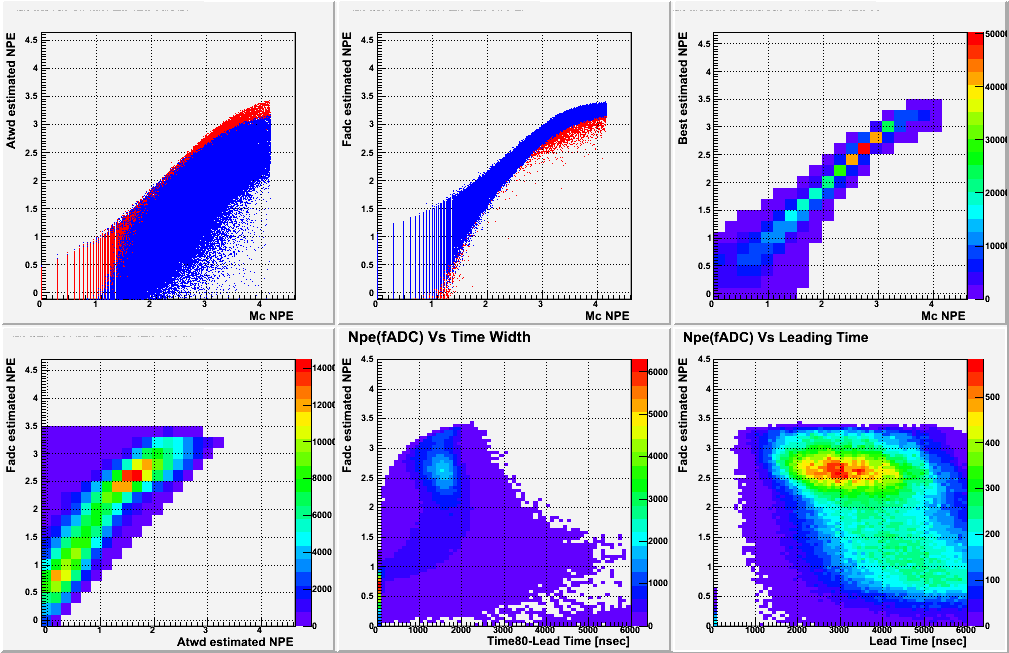
Npe Vs MC-hits (V01-09-01)
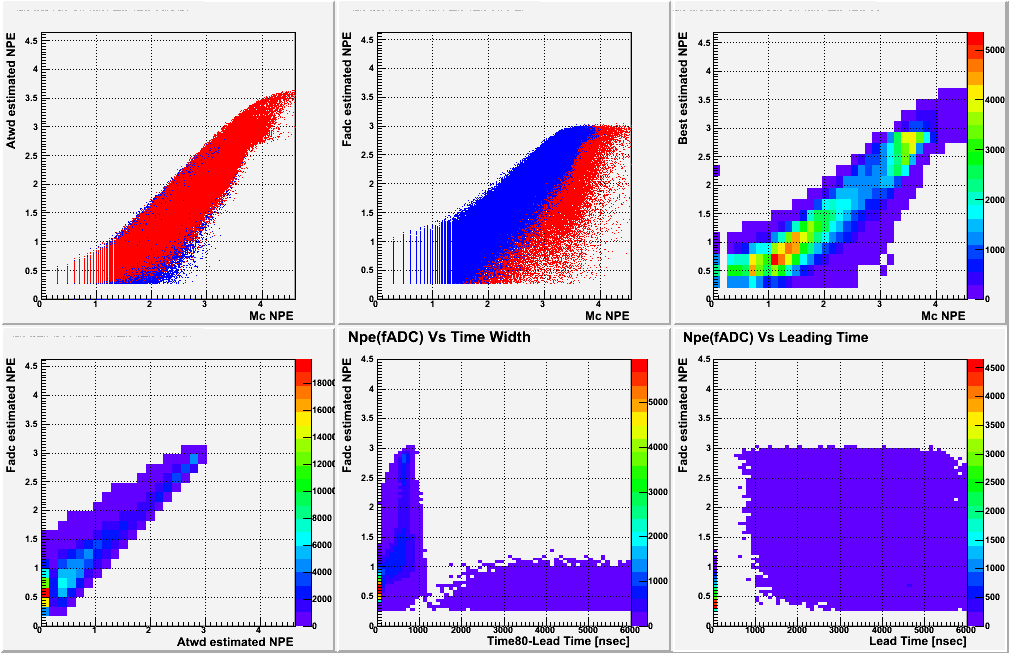
Blue: case of fADC recording larger charge. Red: ATWD larger.
Npe Vs MC-hits (V01-09-03)
All the difference from the plots above is expected from the smaller number of FADC bins (50).
Only a part of charge from an event can be captured.
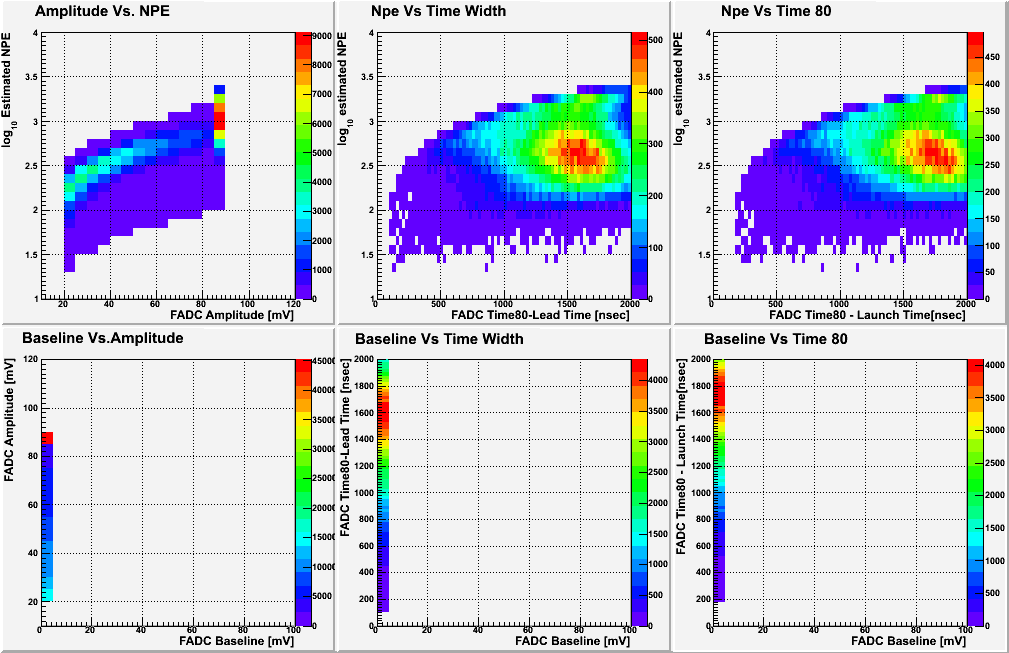
FADC waveform behavior (V01-09-01)
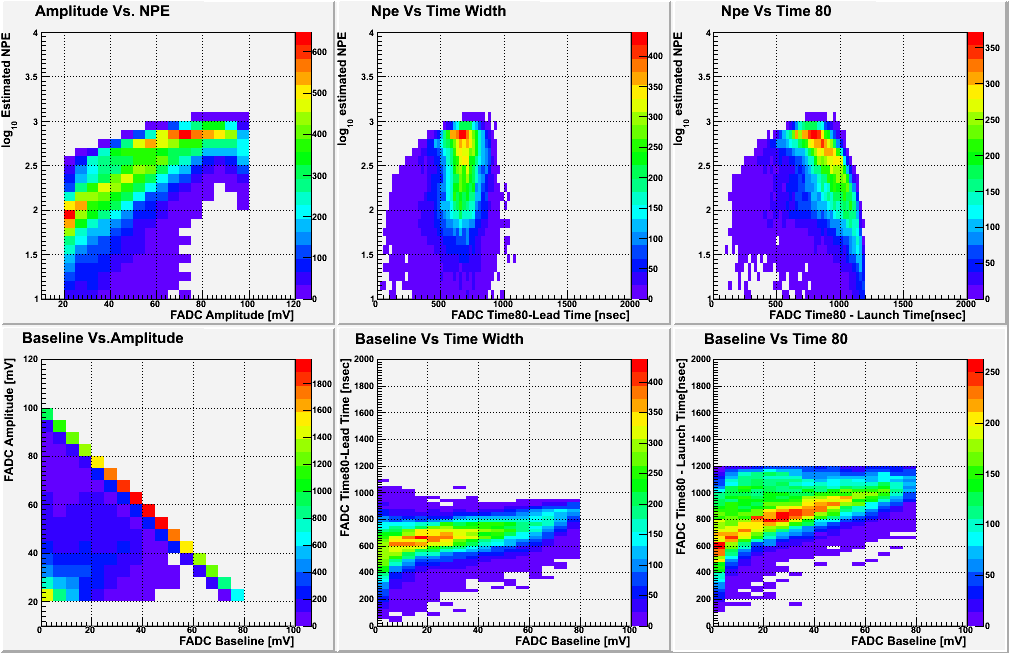
FADC waveform behavior (V01-09-03)
It shows disadvantage of the smaller number of FADC bins.
You can see the baseline determination by Portia did not work well.
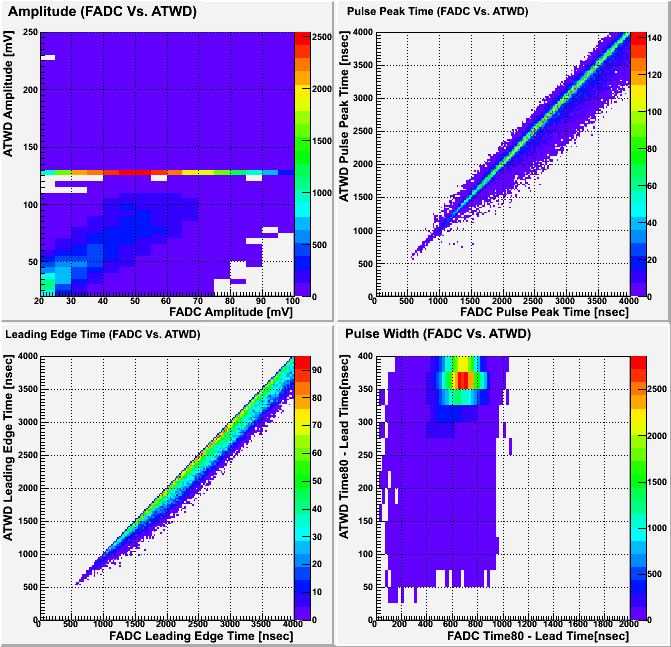
FADC Vs ATWD (V01-09-03)
You see the ATWD amplitude distribution has a strange peak around 127 mV. It must be a simulation bug.
V01-09-01 did NOT exhibit this behavior.