
MC data E^-1 generated by Chiba(~3900 events) and E^-2 by Madison (~9700 events)
5.0 < logE [GeV] < 11.0
![]()
|
ATWD Amplitude Cuts: |
Comments |
|
ATWD Charge and fADC Charge Correlation (Aya) 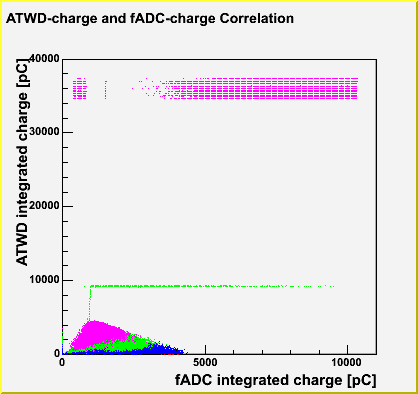
|
Population of high ATWD amplitude consists of pulses with peak captured in ATWD timewindow. But they are saturated in FADC because the FADC saturation level is only 80 mV, which ends up with lower integrated charge. In contrast, those with low ATWD amplitude seems too long pulse duration to be captured by ATWD record window, giving FADC-based charge larger than ATWDs. |
|
fADC Amlitude and ATWD Amplitude Correlation (Aya) 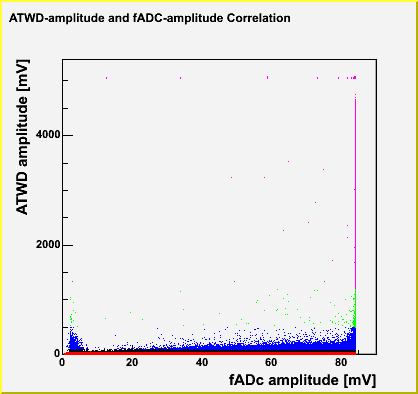
|
It supports the hypothesis above. Pulses with higher ATWD pulses suffers 80mV saturation in FADC waveform. |
|
ATWD Charge and McHit NPE Correlation (Aya) 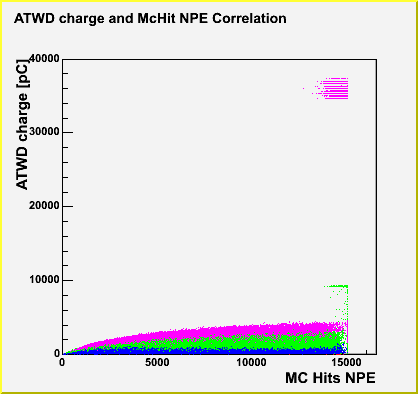
|
This plot also can be explained by our hypothesis. The bule population, low ATWD amplitude guys, includes the case when MC hits are large, because the ATWD time window is too narrow to capture them, missing major contributions from late PE hits. |
|
fADC Charge and McHit NPE Correlation (Aya) 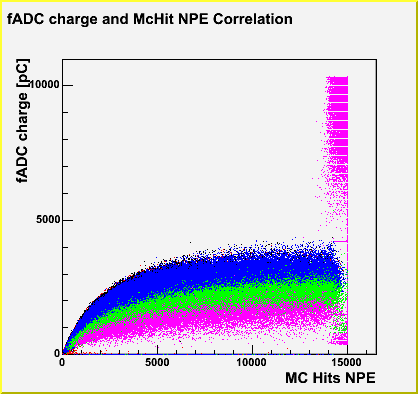
|
Now the trend is reversed to that in the plot above! But it is also consistent with our picture. The low ATWD amplitude (ex. blue) guys are slow pulses, captured by longer FADC time window without suffering 80 mV saturation. |
|
ATWD Peak Position (Aya) 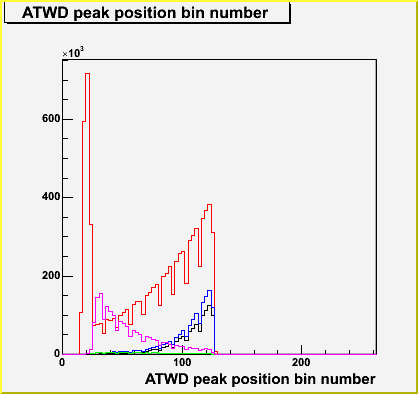
|
This is a direct evidence of our pircture. The high ATWD amplitude (ex. pink) folks are fast pulses, but the low ATWD amplitude pulses are slower, misssing late hits constribution because of too short ATWD recording window. |
![]()
|
Npe distribution (unweighted) gamma=1(left) gamma=2(right) 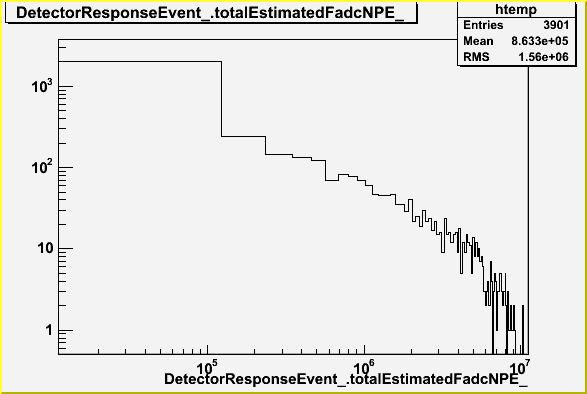 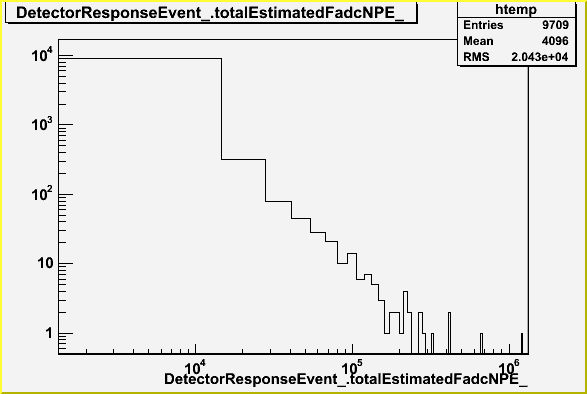
|
|
I3OpheliaFirstGuessTrack initial performance 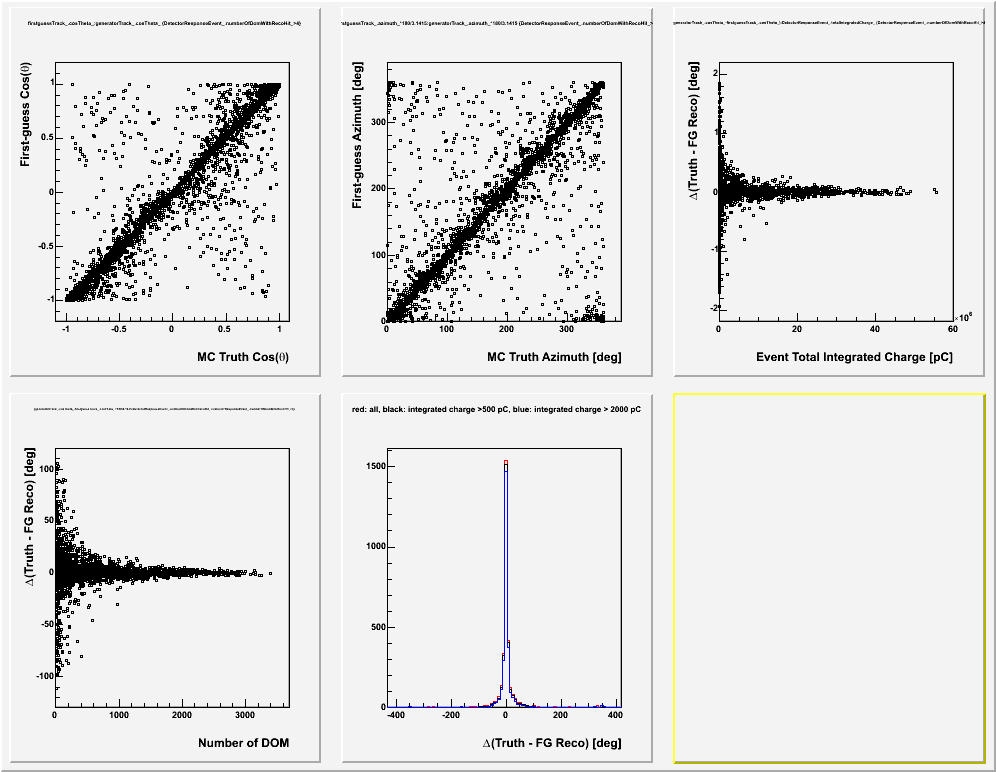
|
|
weighted flux on the cos(theta-MCTruth)-Npe plain. Atm Muon(left) GZK(right) 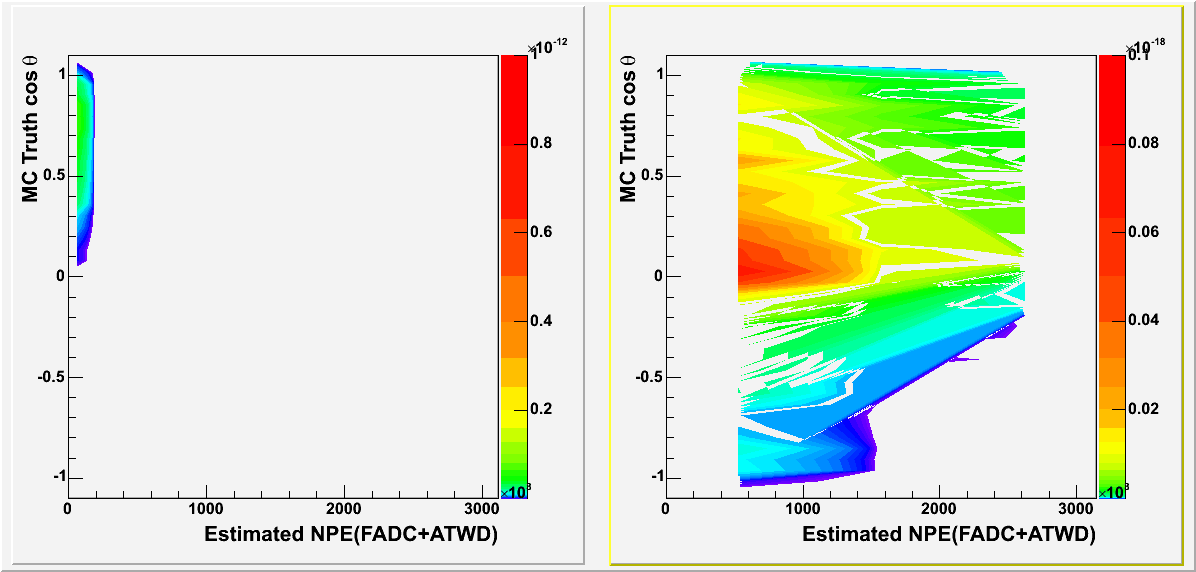
|
|
weighted flux on the cos(theta-1stGuess)-Npe plain. Atm Muon(left) GZK(right). R(COB) <500 m only 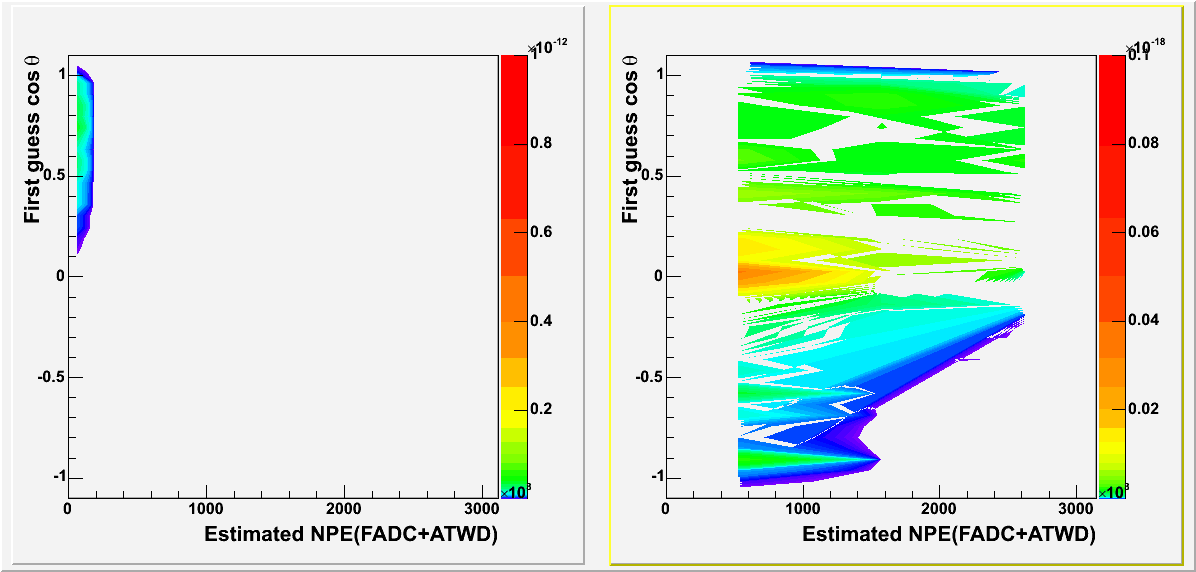
|
|
Effective area/Envet rate as a function of Energy (MCTruth) Tentative "signal cut": Npe > 7.0e5 || cos(theta-MC truth) < 0.1, Npe > 3.0e5 Left panel: Blue up-goling, Green down-going, black total. Rightpanel: Blue GZK, Red Atm Muon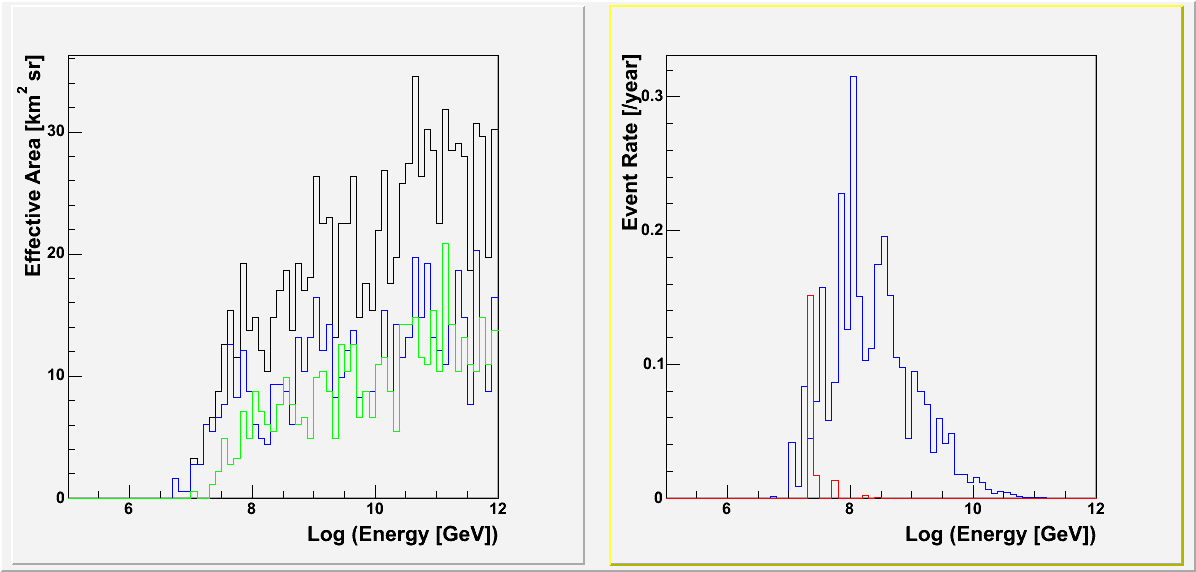
|
|
Same as above, but based on cos(theta-1stGuess) Tentative "signal cut": Npe > 7.0e5 || cos(theta-1st Guess) < 0.1, Npe > 3.0e5 Left panel: Blue up-goling, Green down-going, black total. Rightpanel: Blue GZK, Red Atm Muon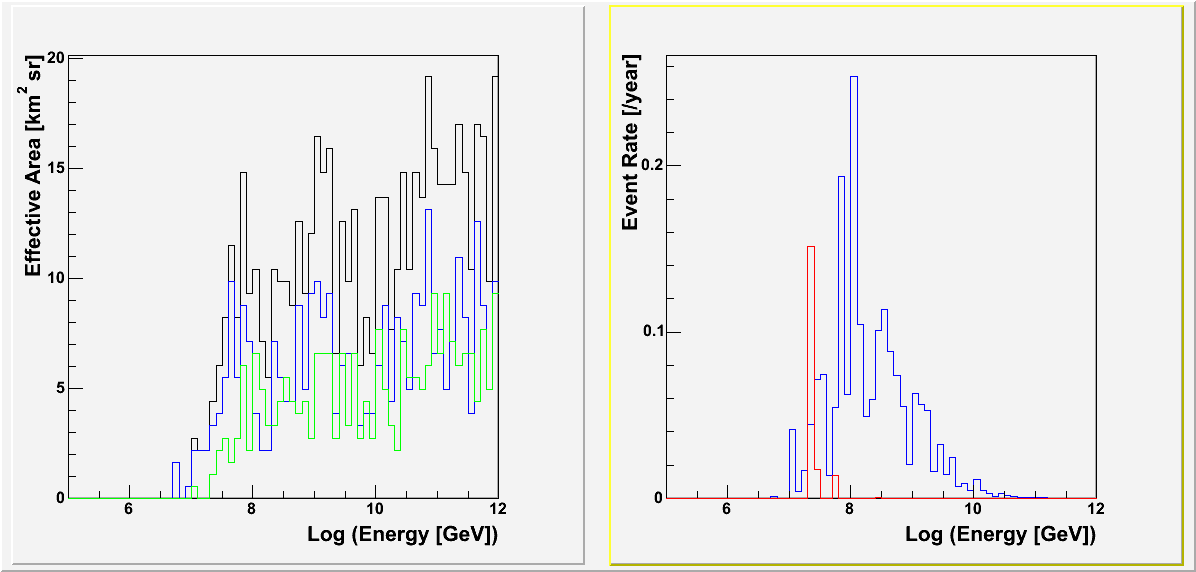
|
|
Effective area/Envet rate as a function of Npe. It corresponds to "ADC sum spectrum" Tentative "signal cut": Npe > 7.0e5 || cos(theta-MC truth) < 0.1, Npe > 3.0e5 Left panel: Blue up-goling, Green down-going, black total. Rightpanel: Blue GZK, Red Atm MuonLower panel: No "signal cut" was applied. "Raw data distribution" 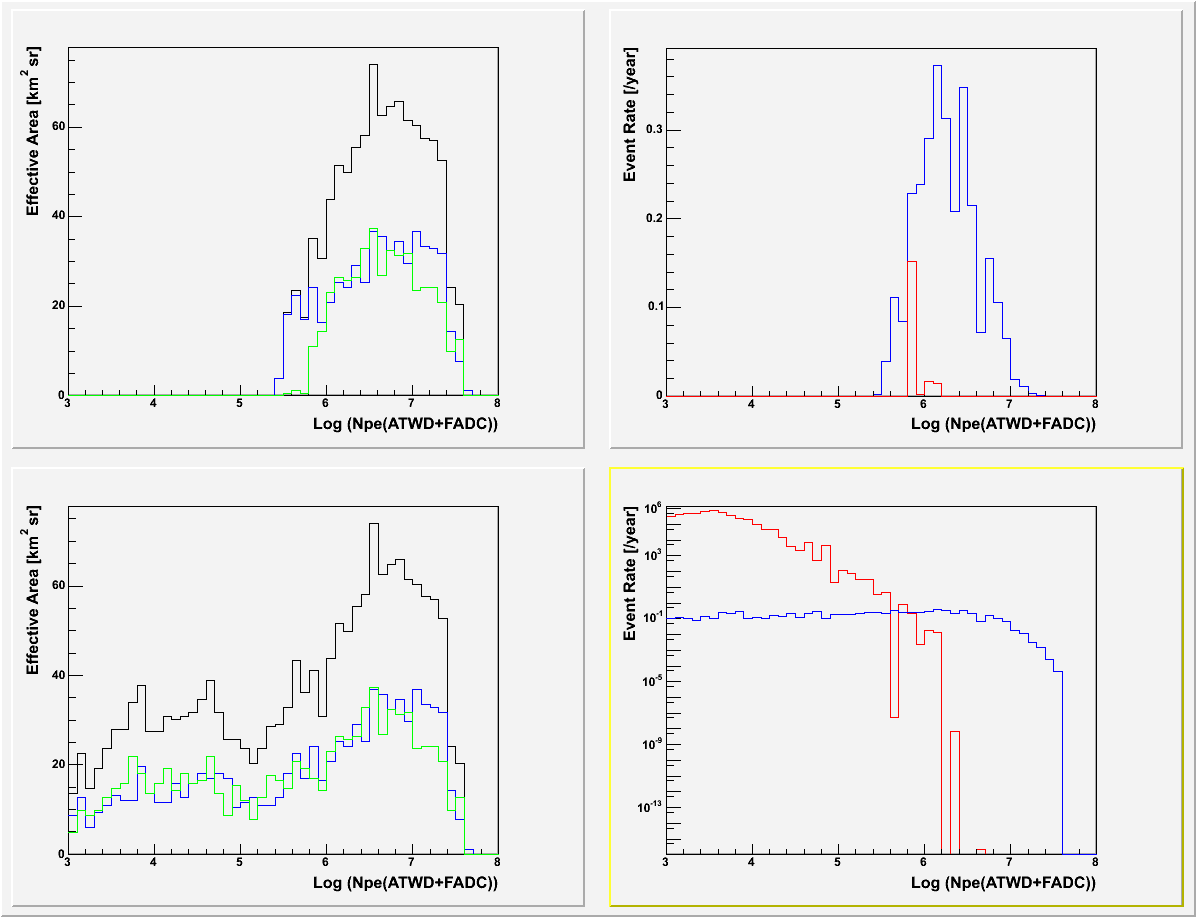
|