The purpose is to study the muon cascade properties for the cascading muon PDF and the better EHE event reconstruction.
The procedure to get the PDF will be followings;
Additionally, the MC healthy check is also done to be sure that our MC is working fine.
Moreover, by checking the fundamental properties of muon cascades, I hope we can come to an idea of the better EHE event reconstruction.
Muon MC are generated using JULIeT.
The energy of the parent muon is from 10^6 to 10^12 GeV.
By using the MC, I checked the properties of the cascades generated by a parent muon.
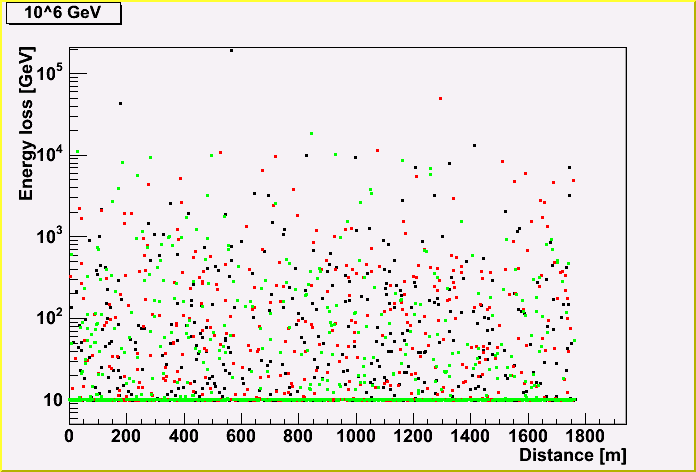
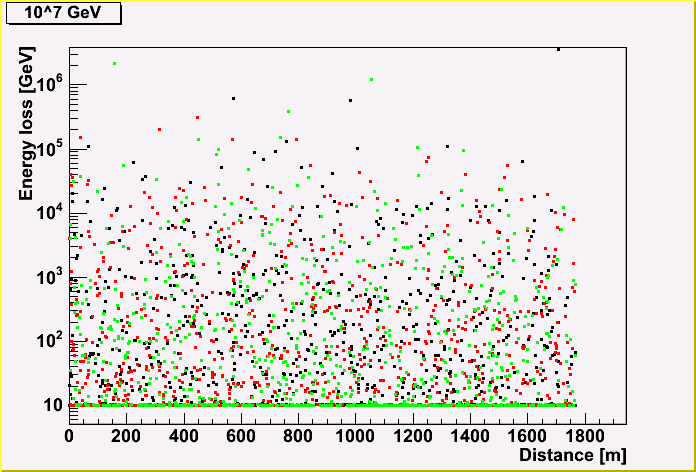
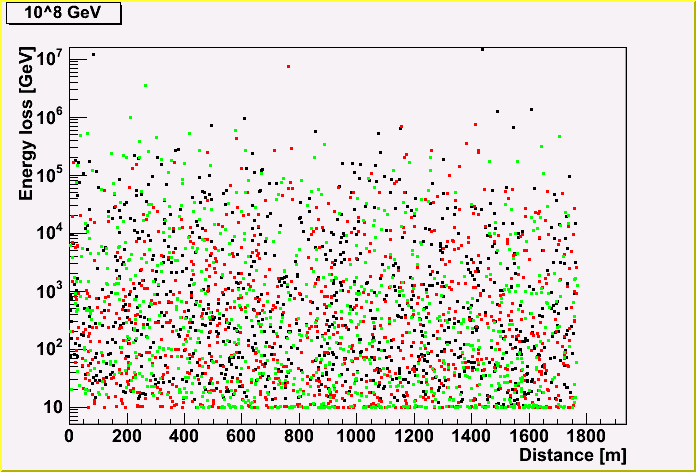
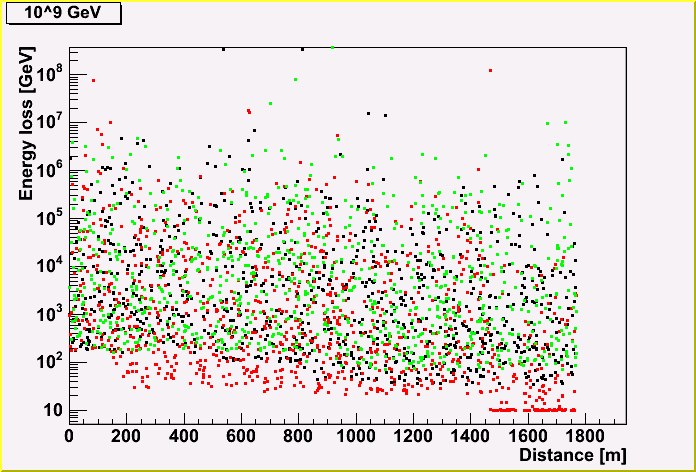
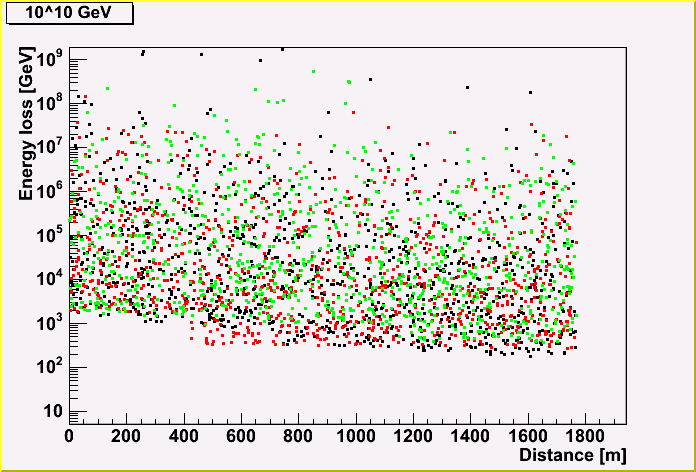
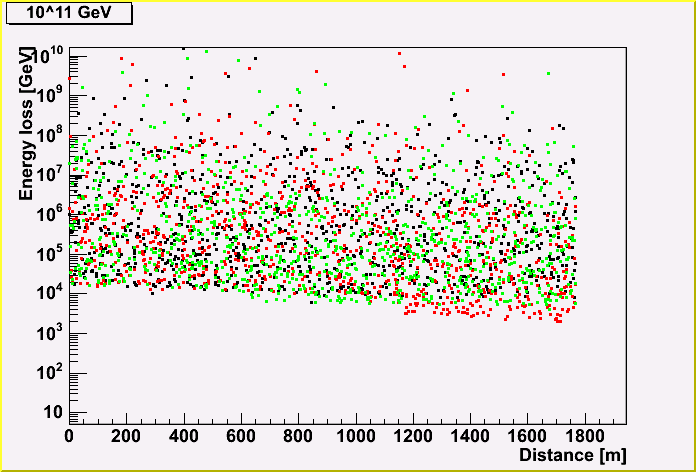
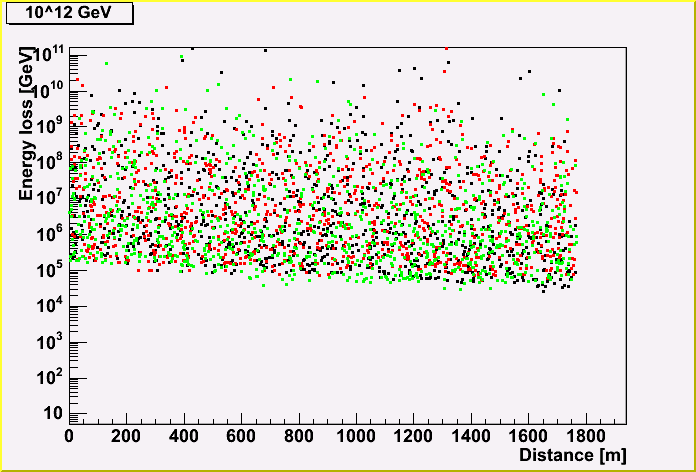
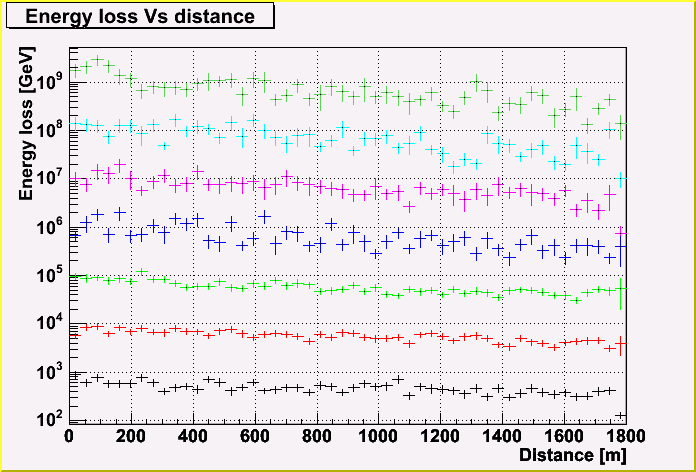
The energy loss (created cascade energy) of a muon track is shown, depending on the distance along the track.
Each point represents the energy, and the same color represents the same track. (There three tracks are shown in a plot.)
As you can see, the more initial muon energy, the more energy loss. You may also notice that the energy loss becomes less due to the energy loss of a muon.


Then, I plotted the average and the deviation of the energy loss every distance.
Now, you may see the energy loss of the parent muon better.
Be careful that the statistics in each plot is different in defferent initila muon energy.
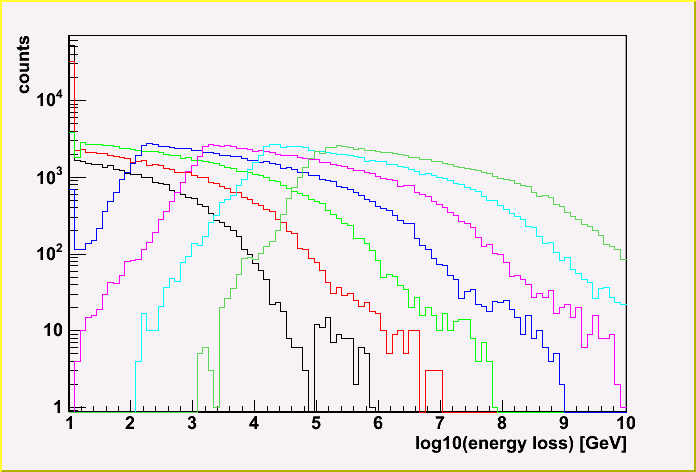
Here, the histogram of the energy loss by a cascade.
Here, you see again the more initial muon energy, more energy loss.
The energy loss by each cascade generated by a parent muon is shown for each energy.
Each energy loss is averagely less than 0.1 % of the parent muon energy. The more parent energy, the more energy loss ratio.
The deviation is quite big (~an order of magnitude). Here, the deviation is the one of the distribution for a track (event). (Not the error of the mean value.)
This means that sometimes there is a very big cascade.
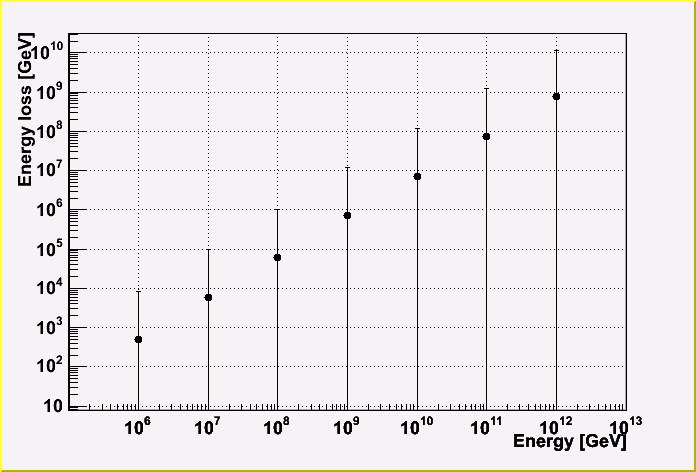
I also made a fit, and found
[Energy loss in a cascade] = (-125.2+-349.7)+(6.214+-2.198)*10^{-4}*[Initial Energy].
This function passes the origin, meaning that we can scale the cascading
muon tables. It's good;)
Christopher W. pointed out the effect of the software artifact. The software gives 10 GeV if the energy loss is below 10 GeV, which is shown in the first plot.
I checked this effect, and found that he is right. There is an artifact effect for 10^6 and 10^7 GeV. Therefore, I re-fit the relation between energy loss of each cascade and parent energy without using 10^6 and 10^7 GeV.
I also change the form of the function to a*E^b, and found
[Energy loss in a cascade] = (4.486+-4.896)*10^-4*[Initial Energy]^(1.0204+-0.0434).
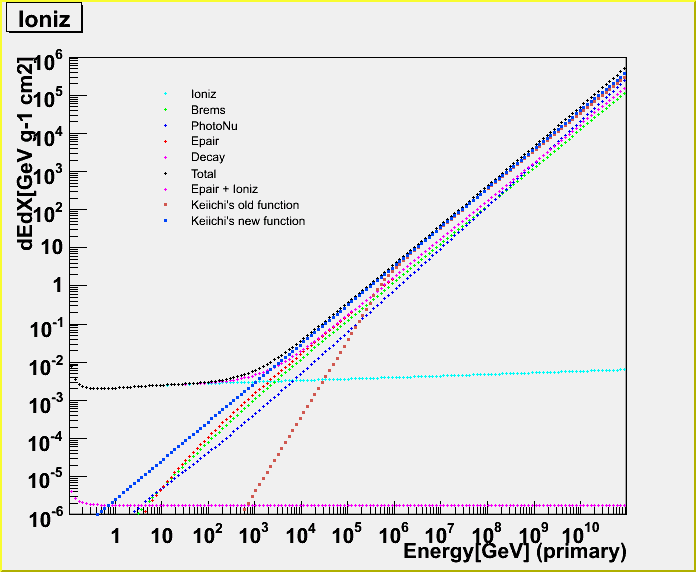
Kotoyo H. also checked whether my function is consistent with the energy loss derived by Dima.
The blue points are new function, and the brown are old function. There is not so much difference between them except for the lower energy. (Becuase of the old form, we introduced dummy function (The 2nd polinomial function) for making reconstruction work.)
As seen, my function is more or less consistent with Dima's theoritical value. There is some difference at very high energy, but I think it's due to a model difference of photo-nuclear interaction.
Because of the function form, now my function is extended to lower energy, and improved (meaning that it becomes closer to Dima's) at very high energy.
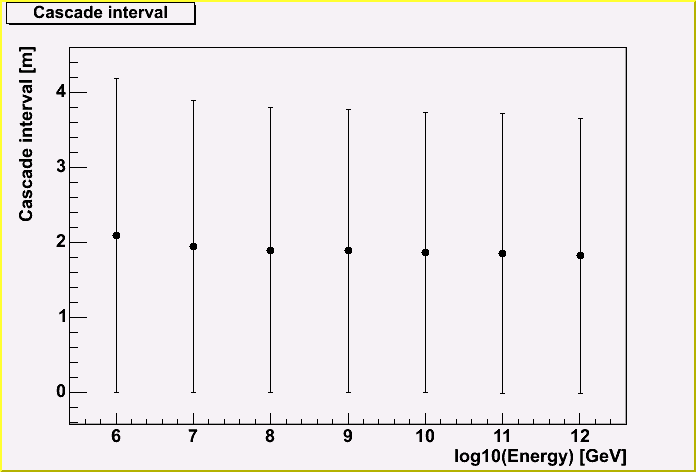
Here, the interval of each cascade is shown for each initial muon energy.
The interval is roughly same, and it's 2 m, not depending the parent muon energy.
Because the interval follows the Poisson statistics, so the deviation is also same order of the interval. Here also, the deviation is width of the distribution for a track.
This result means that we can safely assume that the cascades are continuous becauase the 2 m is smaller than the detector interval.
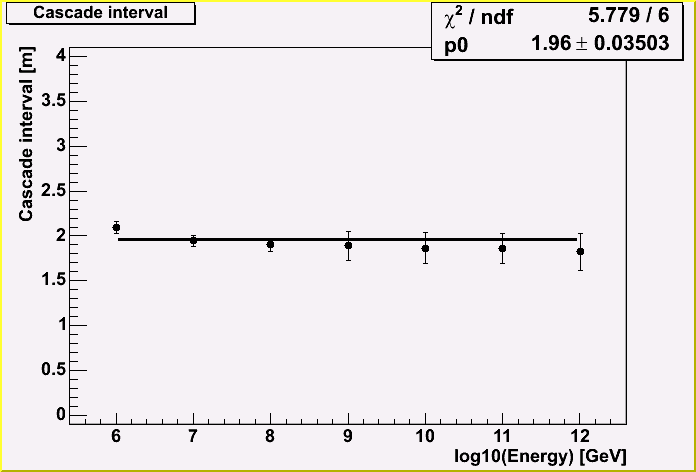
Taking into account the statistics of all events, I made a fit by the polinominal 1st order.
As you can see, the chi-square value is good. It might be better to use the 2nd polinominal, but in such a case the reduced chi-square value becomes too small. Moreover, it will be difficult to make the cascading muon tables. If we can assume the interval is constant for all energy range, we can just scale the table, depending on the energy. If this intervals depends on energy, we will have to make the tables for each energy.
Therefore, let us assume that the interval is constant of 1.96 m.
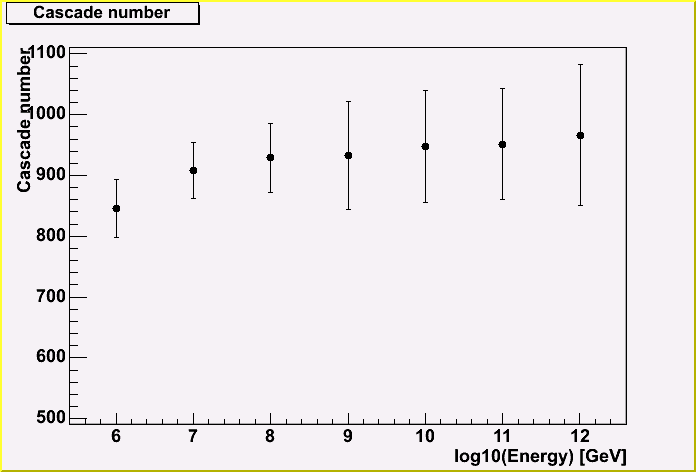
Here, the number of cascades in a track is shown for each energy.
This number also doesn't depend on the incident energy so much, and it's about 900 cascades.
This is quite an important plot, I think.
The color in the plot means the followings;
The theory value is derived from using the beta term in the mathematical note page.
When we don't take into account the energy loss during the trip, the total energy loss becomes higher. So, the red points exceed the MC by roughly 30 %.
When we take into account the effect, the theory match with the MC at low energy, but for high enegy there is still some difference. In this case, the theory value with the effect is below MC. This is due to the fact that I didn't take into account the energy dependence of the beta term. At low energy, the beta term doesn't depends on the energy, but do at high energy.
Considering these fact, the conclusion is that MC is working fine.
The total energy loss is roughly 40 % at 10^6 GeV, then it goes up with the energy. At 10^12 GeV, the total energy loss is up to roughly 70%!.
The important thing is that the error in this plot represents the error of the energy reconstruction by using only this parameter. The error at 10^6 GeV is roughly 60 %, and it's improving with the energy. At 10^12 GeV, the error is roughly 30 %.
I would say this is a good news. By using only this simple parameter, we will be able to reconstruct the events roughly 30 % at extremely high energy region, though we only can know the part of this information because the detector can detect only the part of this information.
Moreover, we will be able to make it better by taking into account the timing information or more fancy parameter, I hope.
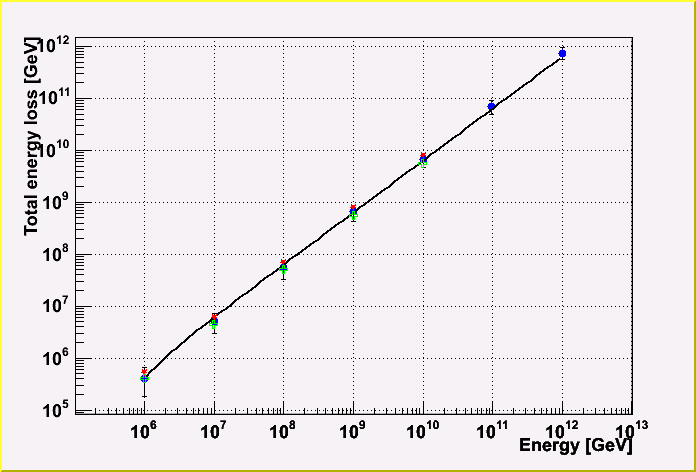
The result of the fit is
[Total energy loss in a track] = (-2.302+-2.560)+(6.336+-0.956)*10^{-1}*[Initial energy].
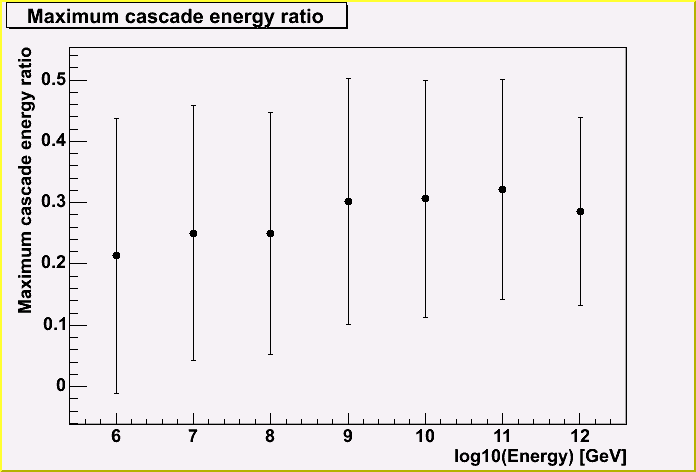
At last, the ratio between the maximum cascade in a track and the initial energy of a muon is shown.
As you can see, it's constant with 20 %, though again the deviation is large. But, the this information will also be somewhat useful to reconstruct the EHE event because it doesn't depend on the parent energy. (maybe only at low energy (~10^6 GeV), where is a bigger deviation of the total energy loss.)
