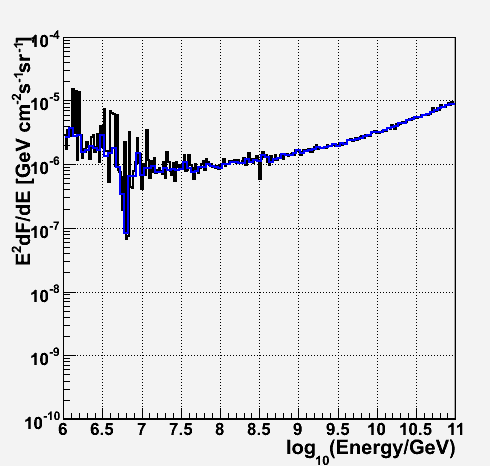
Cut optimization


Without CoGZ information

Cut optimization

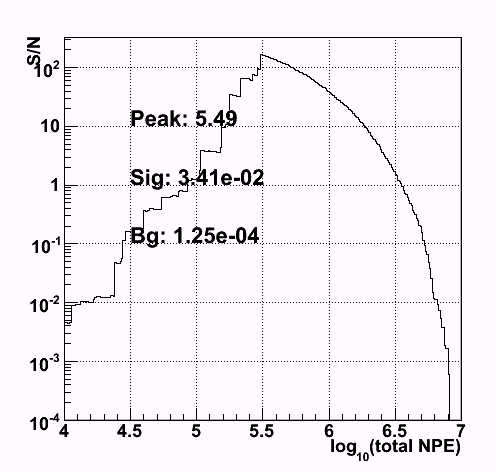
At first the cut position is roughly determined by searching the position where the signal to background ratio becomes maximum. Note that I fixed the background amount to 1.e-4/(0.1*cos(ZA)) if the background becomes less than the amount.

The example of the signal to background ratio is shown below.

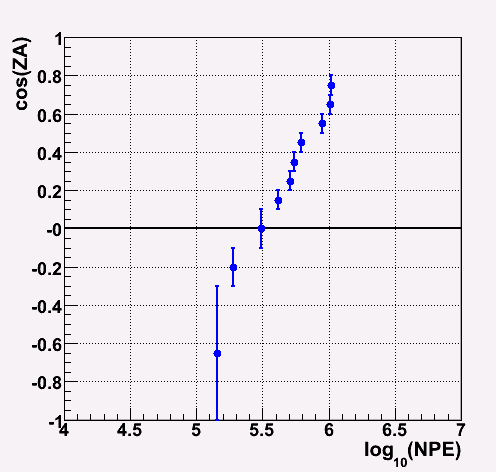
The determined rough cut points are shown below.

example of the signal to background ratio
(-0.1 < cos(ZA) < 0.1)
Cut position for each zenith angle
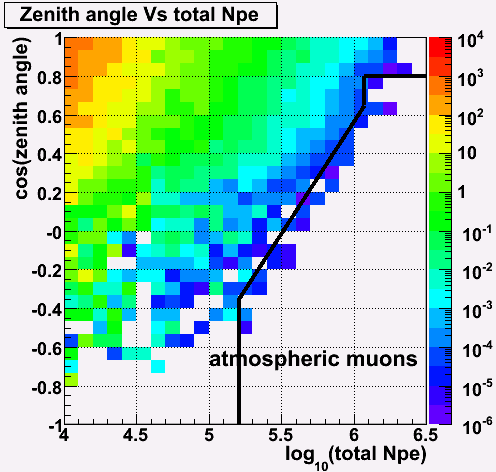
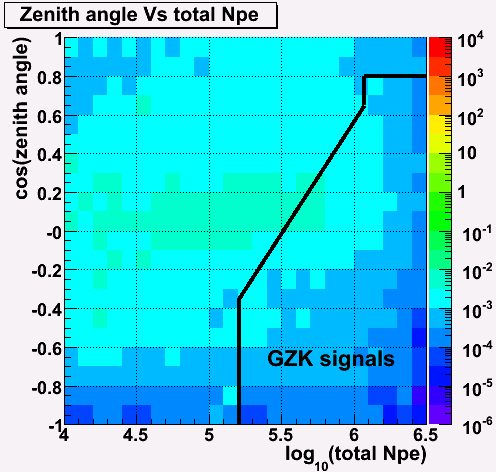
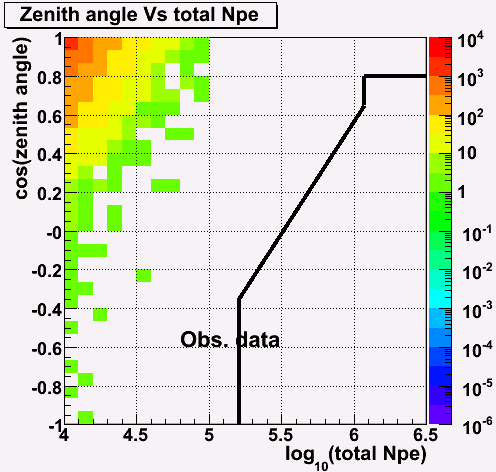
After determining the rough shape, I made several lines to express the shape as shown below. (Actually, the lines indicate the optimized the cuts.)

Background

EHE signal

Real data

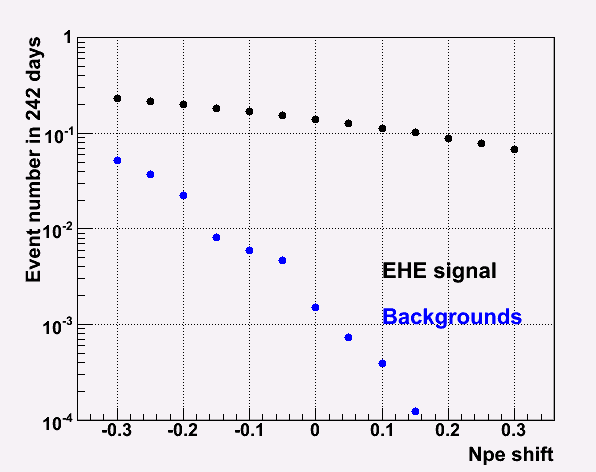
Then, I shifted the lines in NPE direction. I took the Npe shift (0.05) in order to keep the signal to background ratio of 200. (In the above plots, this Npe shift is already taken into account.)
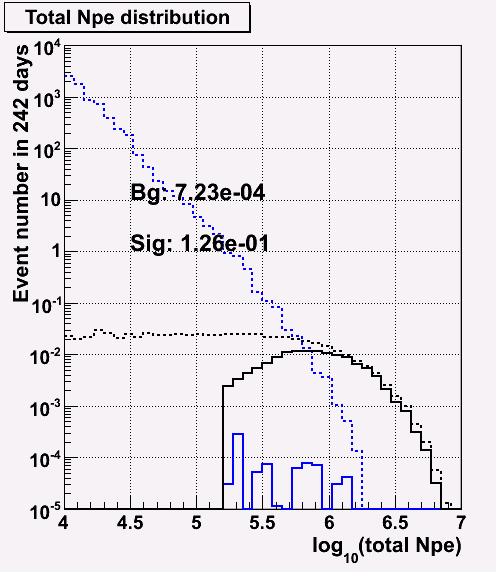
NPE distribution before and after cut

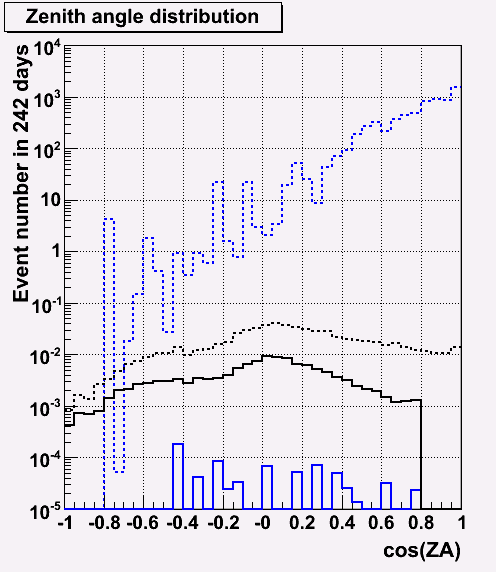
ZA distribution before and after cut

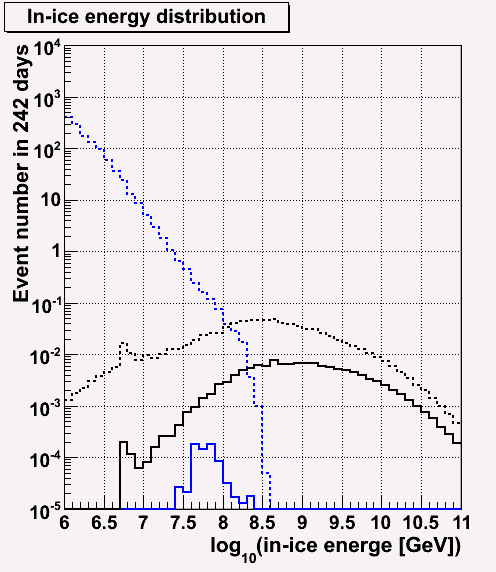
Energy distribution before and after cut

With CoGZ information

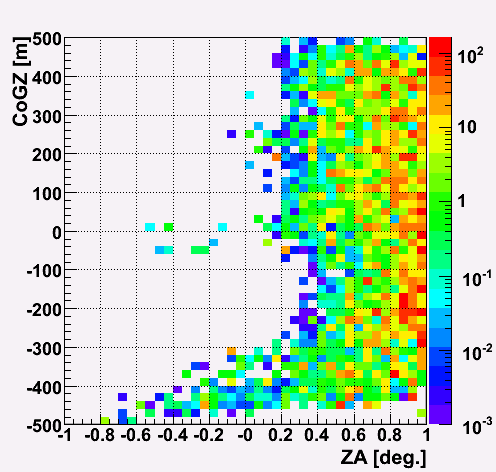
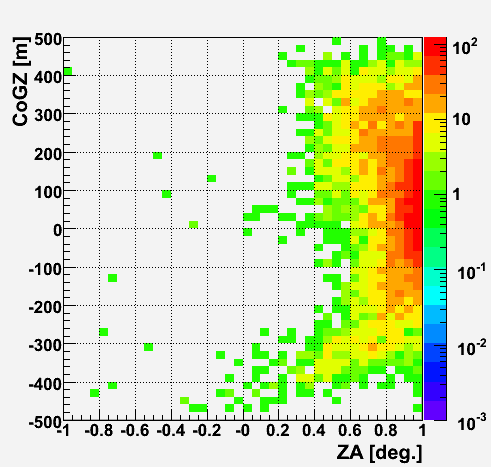
It turned out that there is a place that events tend to be mis-reconstructed horiontally where the ice is clean. Therefore, I divide the events into two groups by the CoGZ position.

One is -50 < CoGZ < 50 m and CoGZ < -250 m where the ice is relatively clean, and the another is other CoGZ position, namely CoGZ > 50 m and -250 < CoGZ < -50 m.

CoGZ Vs ZA (empirical model)

CoGZ Vs ZA (obs. data)

Cut optimization

The cut is optimized in the same way as mentioned above.

The determined rough cut points are shown below.

Cut position for each zenith angle
CoGZ < -250 m and -50 < CoGZ < 50 m

Cut position for each zenith angle
-250 < CoGZ < -50 m and CoGZ > 50m

Background
CoGZ < -250 m and -50 < CoGZ < 50 m

EHE signal
CoGZ < -250 m and -50 < CoGZ < 50 m

Real data
CoGZ < -250 m and -50 < CoGZ < 50 m

Background
-250 < CoGZ < -50 m and CoGZ > 50m

EHE signal
-250 < CoGZ < -50 m and CoGZ > 50m

Real data
-250 < CoGZ < -50 m and CoGZ > 50m

optimization
-250 < CoGZ < -50 m and CoGZ > 50m
Npe shift of 0.05 is selected.

optimization
CoGZ < -250 m and -50 < CoGZ < 50 m
Npe shift of 0.05 is selected.

NPE distribution before and after cut

ZA distribution before and after cut

Energy distribution before and after cut

Sensitivity

Effective area
blue: nue, black: numu, red: nutau
solid: with CoGZ info, dashed: without CoGZ info

Sensitivity
black: Shigeru's optimization, red: my optimization
solid: with CoGZ info, dashed: without CoGZ info


With CoGZ information (using only blinded region)

NPE distribution before and after cut

ZA distribution before and after cut

Energy distribution before and after cut

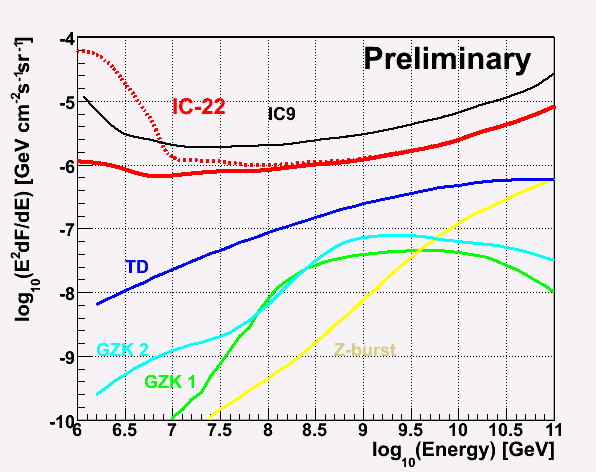
Sensitivity
black: IC9, red: IC22
solid: with CoGZ info (using unblinded region),
dashed: with CoGZ info (using only blinded region)


Comparison with IC9 results

Effective area
black: nu_mu, red: nu_tau, blue: nu_e
solid: IC22 (with CoGZ information), dashed: IC9

Effective area (total) (all flavor sum (nu_e+nu_mu+nu_tau)
black: IC9, red solid: IC22 with CoGZ info, red dashed: IC22 without CoGZ info

Sensitivity
solid red: with CoGZ info,
dashed red: without CoGZ info
solid black: IC9,
dashed red: IC9 (live time normalized to IC22)

Ratio of Sensitivity and effective area (IC22/IC9)
blue: with CoGZ info, black without CoGZ info,
solid: ratio of sensitivity (IC22/IC9), dashed: ratio of effective area (IC22/IC9)
It seems that the effective area of IC9 is overestimated or the sensitivity of IC9 is underestimated... Or, IC22 has the problem???

Event rate for GZK neutrino (model 4)
In order to check the event rate from cuts, I calculated the number with derived effective area and the GZK flux.
solid red: IC22 with CoGZ info,
dashed red: IC22 without CoGZ info
solid black: IC9,
dashed black: IC9 (live time normalized to IC22)
blue: IC22 (yoshida) -- The effective area is derived from his sensitivity curve, using IC9 sensitivity and IC9 effective area curve.


Results by event-wise method

Check the bin size

Total effective area (all flavor sum (nu_e+nu_mu+nu_tau)
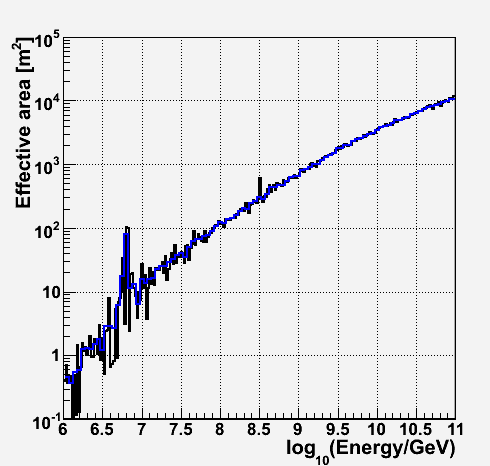
blue: 0.05 bin, black: 0.02 bin

Sensitivity
blue: 0.05 bin, black: 0.02 bin

Comparison with results derived from in-ice effective area

Total effective area (all flavor sum (nu_e+nu_mu+nu_tau)
red dashed: with in-ice effective area table (IC22),
red solid: event-wise (IC22)
black: IC9

Effective area
solid: event-wise method, dashed: from in-ice effective area
black: nu_mu, red: nu_tau, blue: nu_e

Sensitivity
red dashed: with in-ice effective area table (IC22),
red solid: event-wise (IC22)
black solid: IC9, black dadhed: IC9 livetime normalized to IC22

Comparison with IC9 results

Total effective area (all flavor sum (nu_e+nu_mu+nu_tau)
red: IC22(event-wise, with CoGZ info)
black: IC9

Effective area
solid: IC22, dashed: IC9
black: nu_mu, red: nu_tau, blue: nu_e

Ratio of total effective area (IC22/IC9)

Comparison with Shigeru's results

Sensitivity
red dashed: Shigeru's (IC22),
red solid: Keiichi's (IC22)
black solid: IC9, black dadhed: IC9 livetime normalized to IC22

Up-going muon (nu_mu)

Effective area (up-going muon + nu_mu)
with CoGZ info

Effective area (nu_mu)
black solid: up-going, black dashed: down-going, red: all solid angle
with CoGZ info

Effective area (nu_mu)
black solid: up-going, black dashed: down-going, red: all solid angle
log10(NPE) > 4 (no signal cut)

ZA dependence

Effective area (all flavor sum (nu_e+nu_mu+nu_tau))
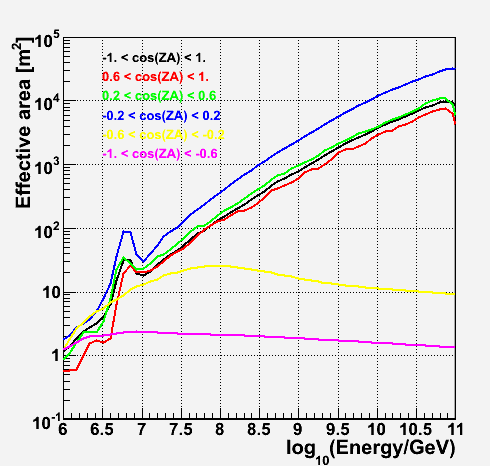
with CoGZ info


Keiichi Mase
Last modified: 2009-02-18 15:44:59