Data check with more statistics (event-wise)

(Wanna see the channel-wise results?)


Data and the procedure

Here, you see results from the 22 strings data.

I used data filtered by myself with a simple script that filters EHE events (#DOM>80).

I used the available data so far(July 7th - Sept. 13th).

The possible signal region is blinded (log10(total Npe)<5.).

Here, you see a script to make root files to analyze data.

The following OMs are ignored based on the level 1 filtering script.

("CleanedKeys",[OMKey(29,59),#Dead/problem list
OMKey(29,60),
OMKey(30,23),
OMKey(30,60),
OMKey(38,59),
OMKey(39,22),
OMKey(50,36),
OMKey(74,9),
OMKey(40,51),
OMKey(40,52),
OMKey(46,49),
OMKey(46,50),
OMKey(46,53),
OMKey(46,54),
OMKey(46,55),
OMKey(46,56),
OMKey(47,55),
OMKey(47,56),
OMKey(56,57),
OMKey(56,58),
OMKey(72,37),
OMKey(72,38),
OMKey(39,8), #Dark Noise mode only DOMS
OMKey(50,58),
OMKey(72,33),
OMKey(72,34),
OMKey(72,35),
OMKey(72,36),
OMKey(72,43),])


Summary

Let me summerize at first. The data generaly looks fine.

The data are consistent with a MC based on the last year's study.

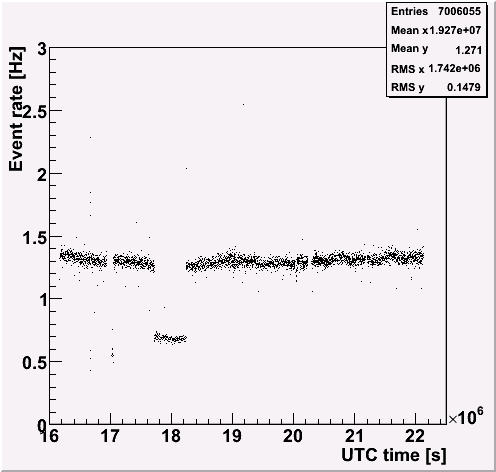
There is some period where the event rate is about half lower. (1.76e7 < UTC <1.83e7)

We should check more and know the reason. Azriel pointed me out that this is due to the prescaling to 2 to save the bandwidth at the period.


1. plots to check the data quality

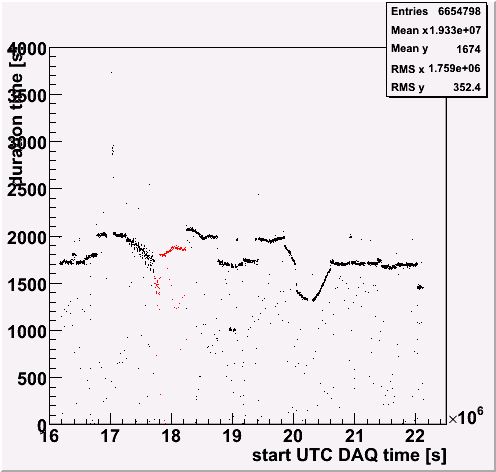
Duration time in each file (not run!).
There is some period where the prescaling was applied (around 1.8e7 UTC (red points)). The duration time for the period is simply reduced by factor of 2.
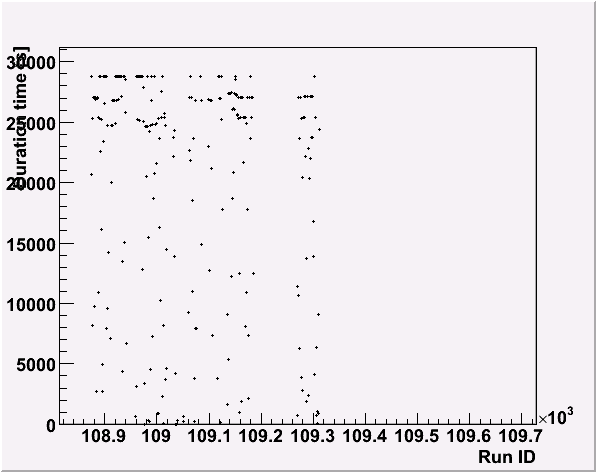
Duration time in each run.
The maximum duration time for a run is 29000 [s] ~= 8 [hr].
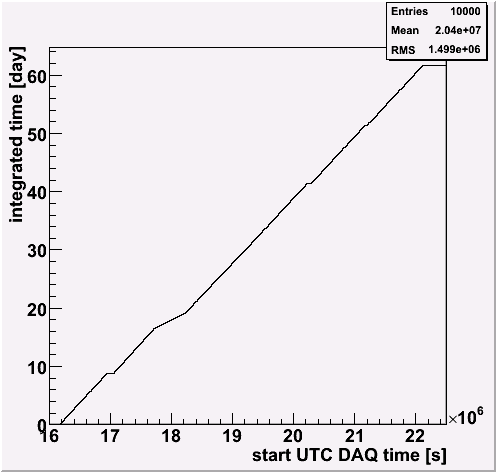
The cumulative duration time. The effective time increases linialy with time, and ~61.7 days in total (so far). There is some period where the prescaling was applied (around 1.8e7 UTC). So, the slope is different for the period. Flasher data are not included (run# 108895, 108896, 108911 and 108912).
Event # Vs Run ID
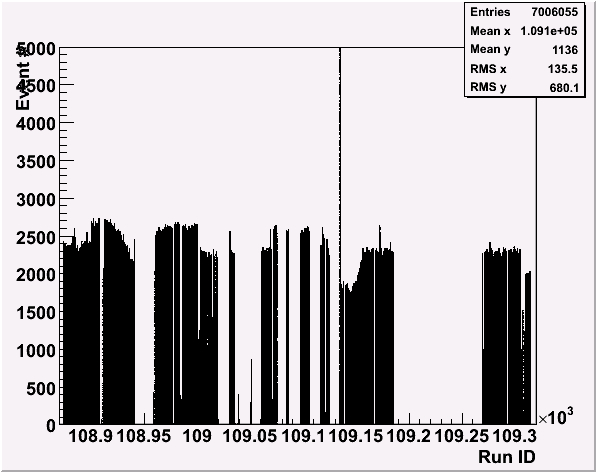
The event rate. It's about 1.3 Hz. There is some data with low rate... There is a correlation between event rate and the duration time (See above plot.(left)). This has to be checked. As I wrote above, this low rate was due to a prescaling to 2 at that time.
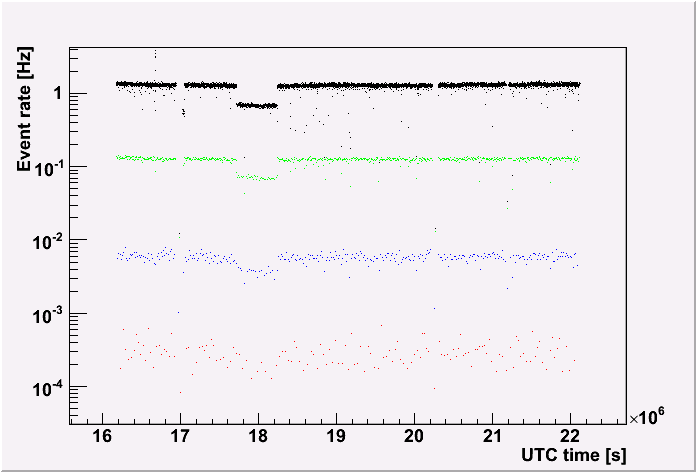
The event rate for each Npe cut.
black: no cut
green: log10(total Npe) > 3
blue: log10(total Npe) > 3.5
red: log10(total Npe) > 4
Strangely, the rate for high Npe is also lower than the other usuals. This is again due to the prescaling.
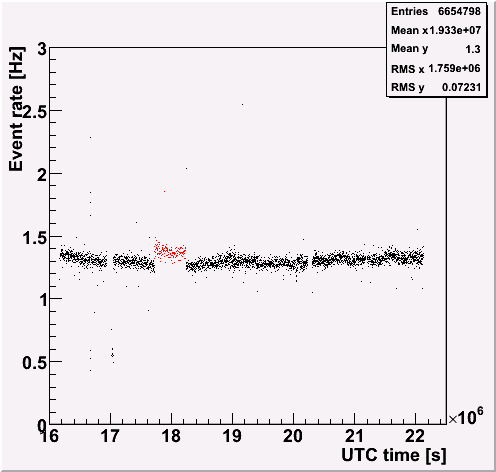
I simply multiplied the rate by factor 2 for the prescaled period (red points).
Now, the rate during the prescaling becomes higher than others. (It turned out this is because I didn't apply the prescale cut correctly.)
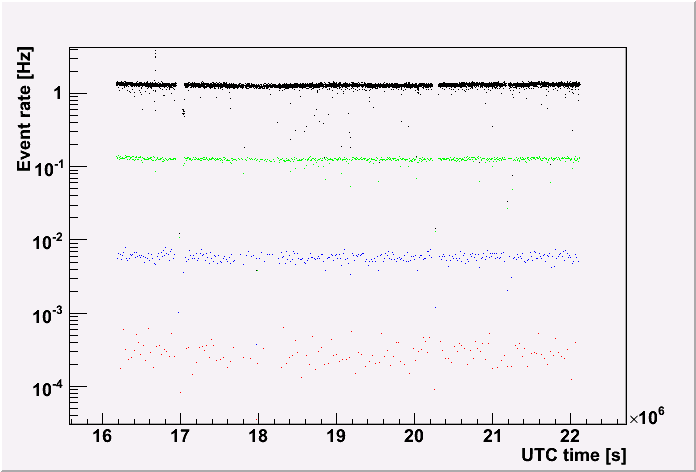
The event rate for each Npe cut after simple prescaling correction (multiply factor 2).
black: no cut
green: log10(total Npe) > 3
blue: log10(total Npe) > 3.5
red: log10(total Npe) > 4
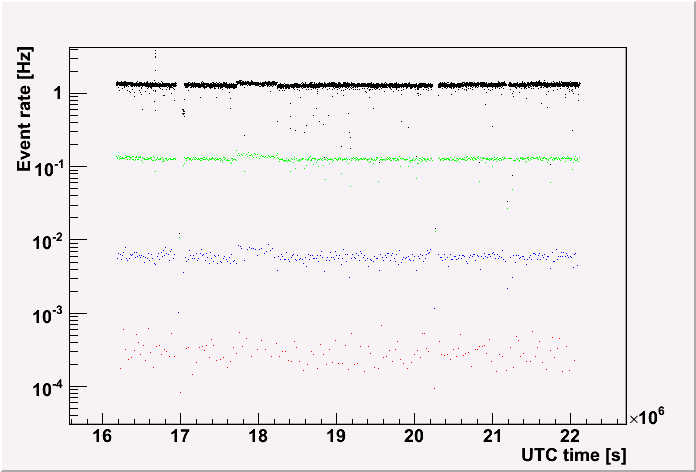
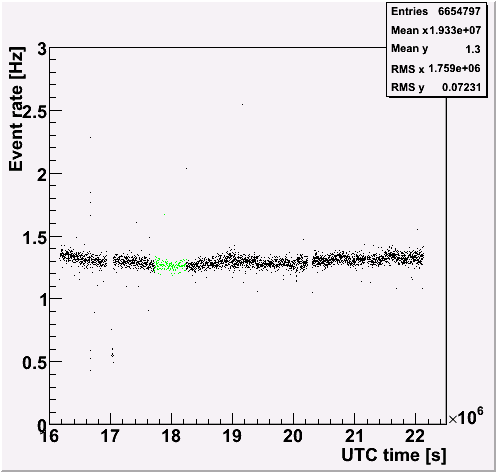
Prescale correction for the prescaled period (green points).
Now, the rate during the prescaling is consistent with others.
The event rate for each Npe cut after prescaling correction .
black: no cut
green: log10(total Npe) > 3
blue: log10(total Npe) > 3.5
red: log10(total Npe) > 4
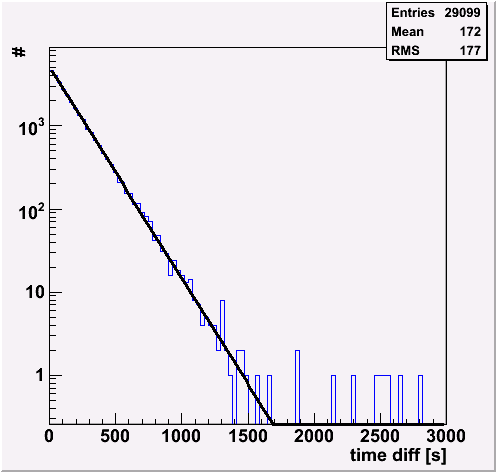
Time difference between events. The slope value is consistent with the rate. There is some tail (mainly due to data of prescaling period). The slope is -1.25.
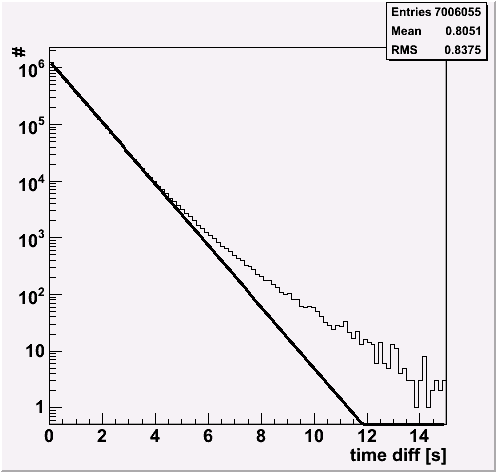
Same as left. With log10(total Npe)>3. The slope is -0.123. This is also consistent with the rate.
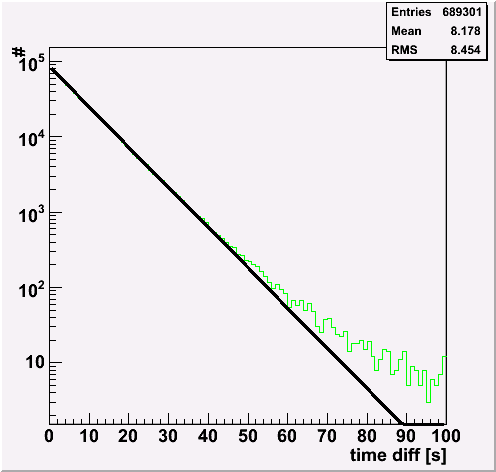
Same as left. With log10(total Npe)>3.5. The slope is -0.0057. This is also consistent with the rate.
Same as above without prescaled data. (cut 1.76e7 < UTC <1.83e7). The tail becomes smaller. (Although, I should probably clean data more.) The slope is -1.30.
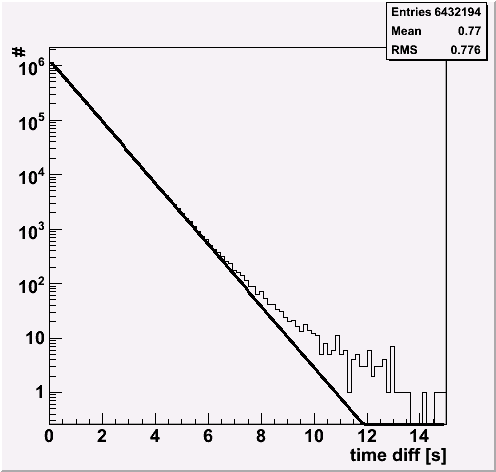
Same as left without prescaled data. With log10(total Npe)>3. The slope is -0.128.
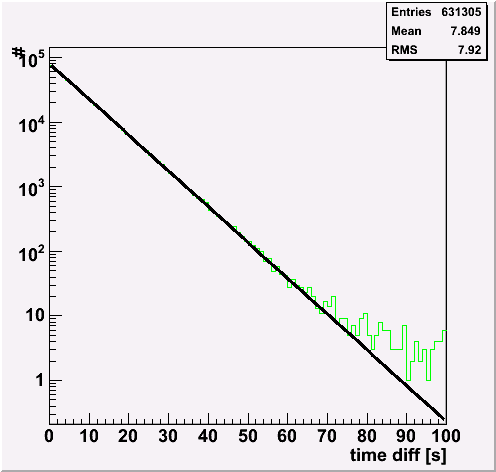
Same as left without prescaled data. With log10(total Npe)>3.5. The slope is -0.0059.
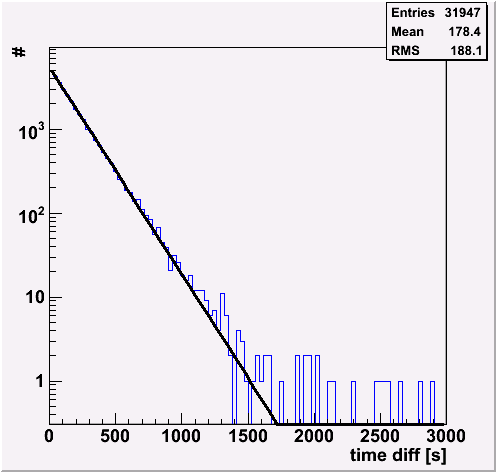
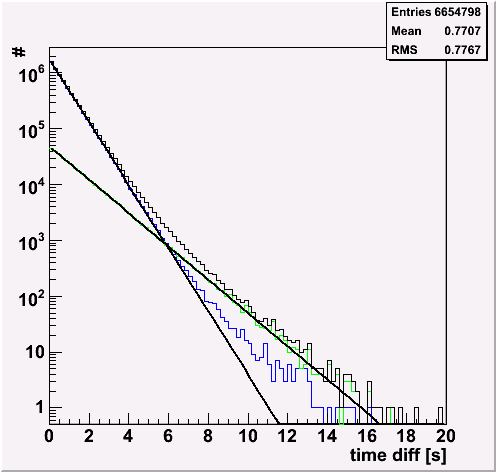
Time difference between events.
Black: all data
Green: prescaled data (1.77e7 < UTC < 1.82e7). (slope: -0.69)
Blue: normal data (UTC < 1.77e7, UTC > 1.82e7). (slope: -1.30)
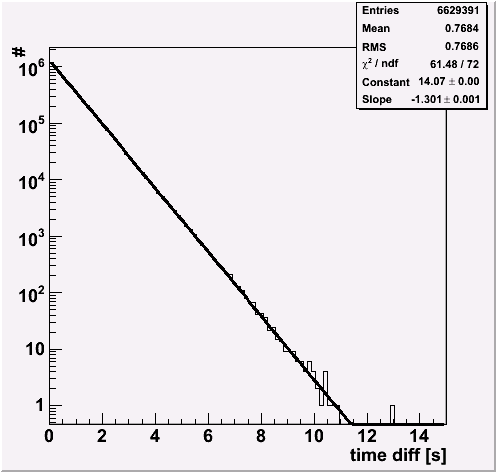
Time difference between events.
I cut the prescaled data and run#108895, 108896, 108911 and 108912 that showed low rate in above plots.
They are tagged as good by the verification group, but the online filtering page says the DB had some problems at that time. It tunrs out they are flasher runs.
After the run removal, the time difference distribution agrees well with the poisson distribution.
2. first-guess
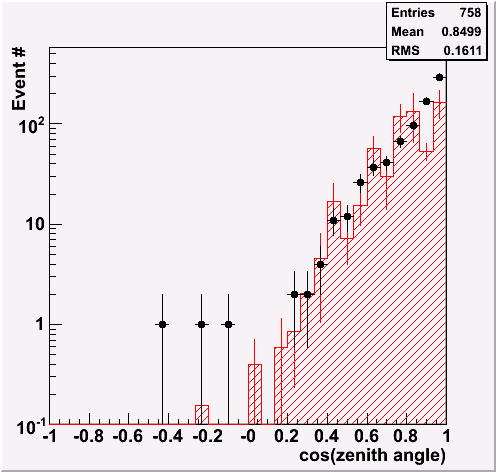
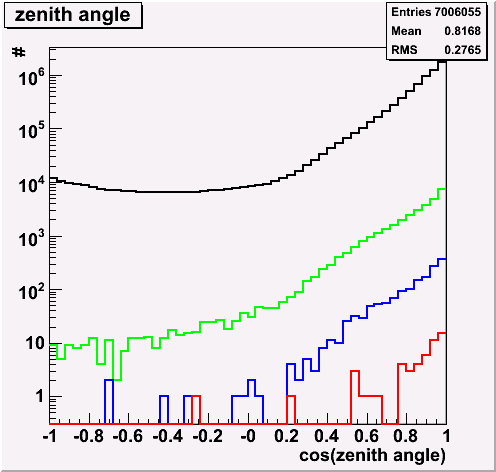
Zenith angle
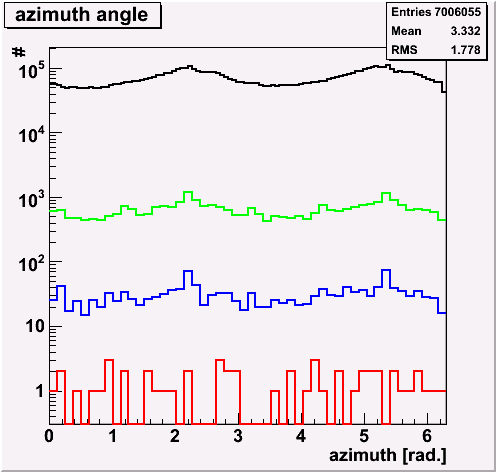
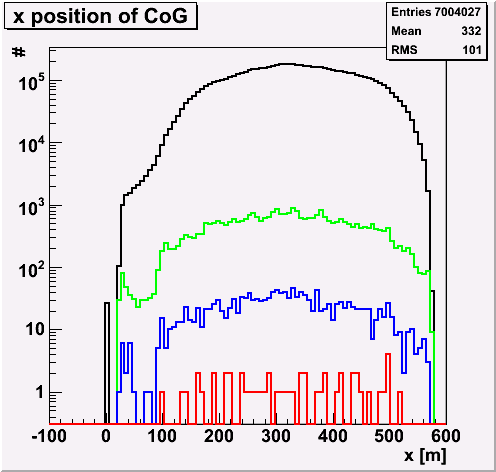
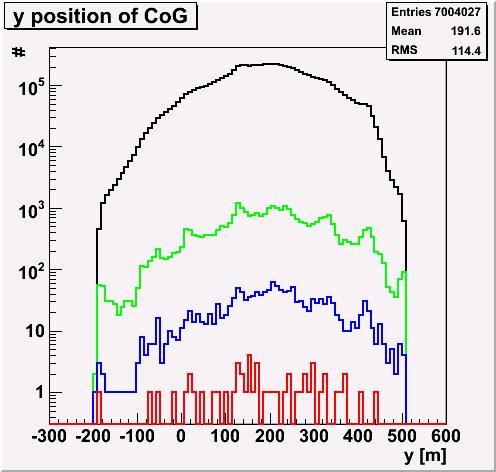
black: no cut (of course blinded!)
green: log10(Npe)>3.5
blue: log10(Npe)>4.0
red: log10(Npe)>4.5

Azimuth angle

X position of the CoG

Y position of the CoG

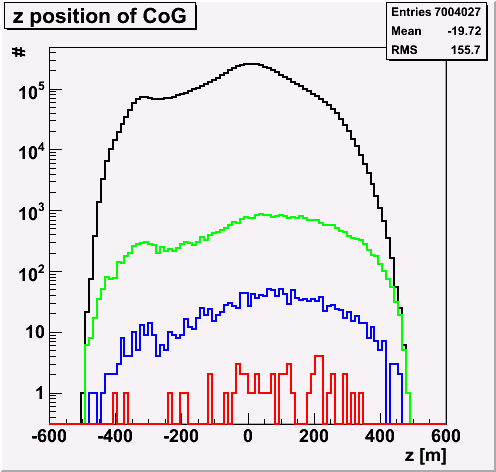
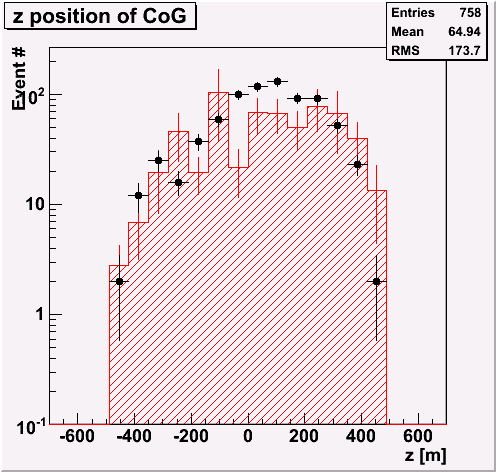
Z position of the CoG

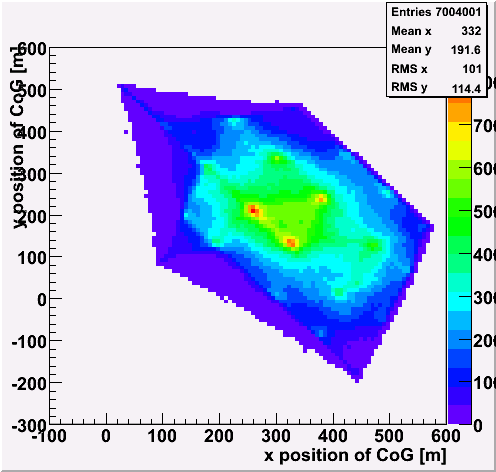
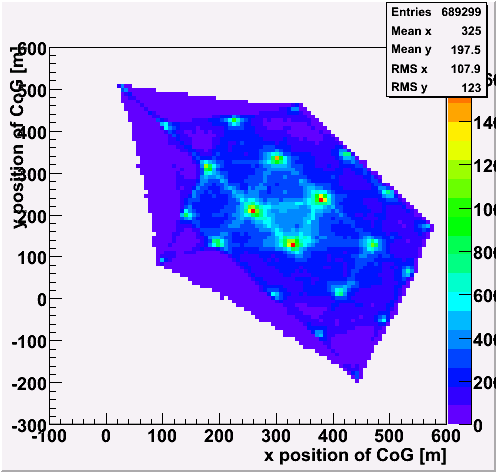
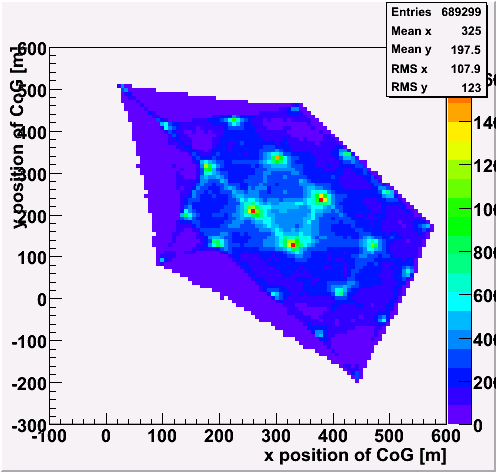
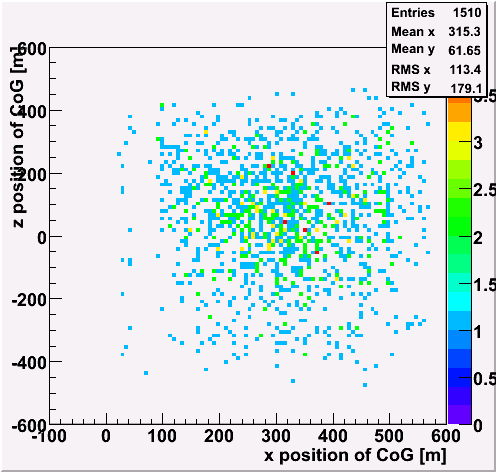
XY position of the CoG. You can see the 22 strings structure.

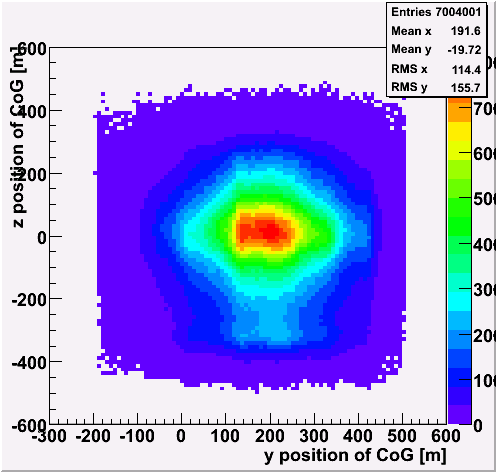
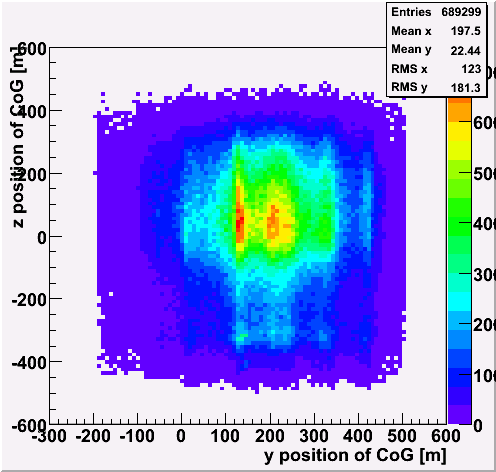
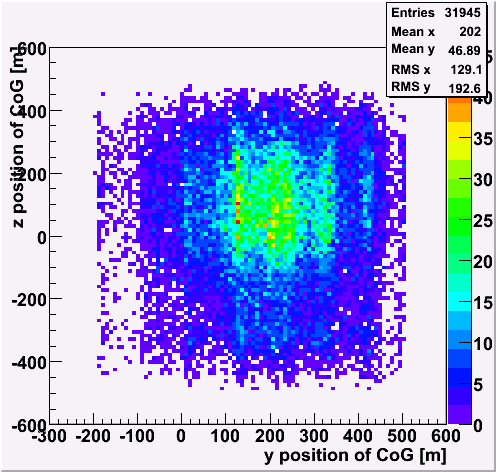
YZ position of the CoG. The bottom part is clearer.

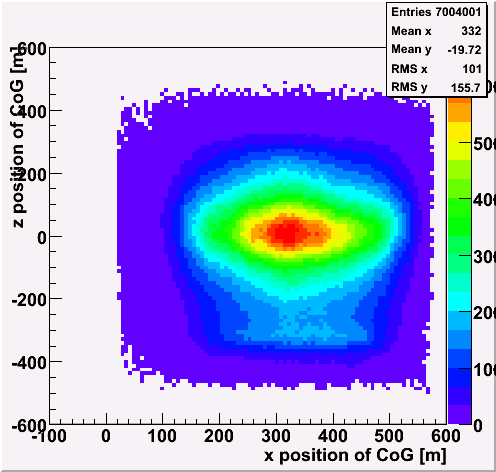
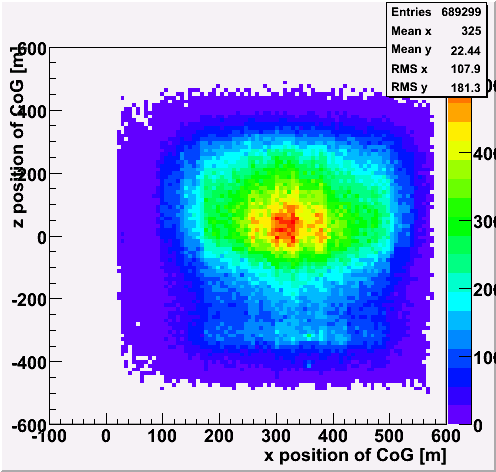
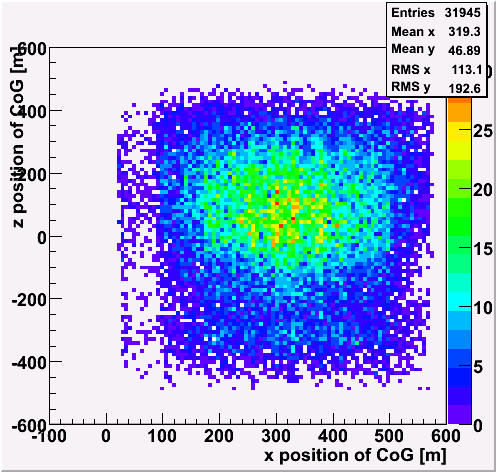
XZ position of the CoG

XY position of the CoG. log10(total Npe)>3. You see the structure clearly.

YZ position of the CoG. log10(total Npe)>3.

XZ position of the CoG. log10(total Npe)>3.

XY position of the CoG. log10(total Npe)>3.5.

YZ position of the CoG. log10(total Npe)>3.5.

XZ position of the CoG. log10(total Npe)>3.5.

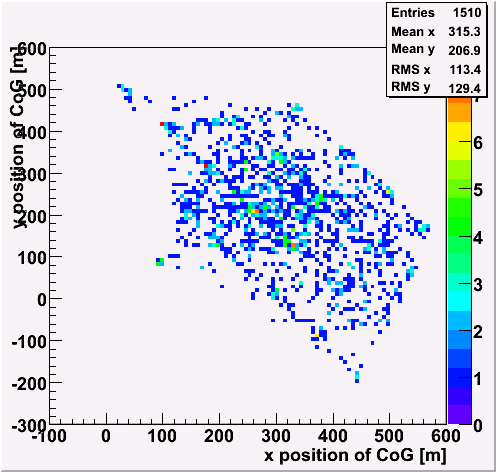
XY position of the CoG. log10(total Npe)>4.

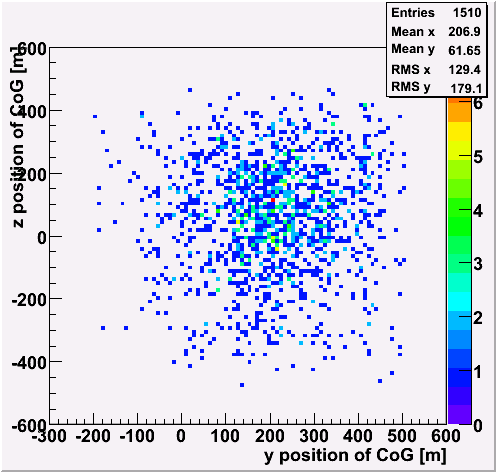
YZ position of the CoG. log10(total Npe)>4.

XZ position of the CoG. log10(total Npe)>4.

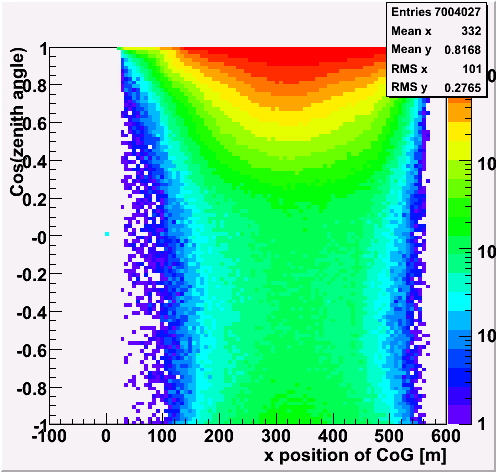
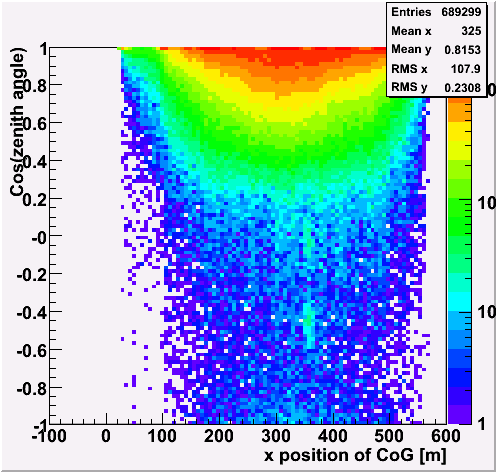
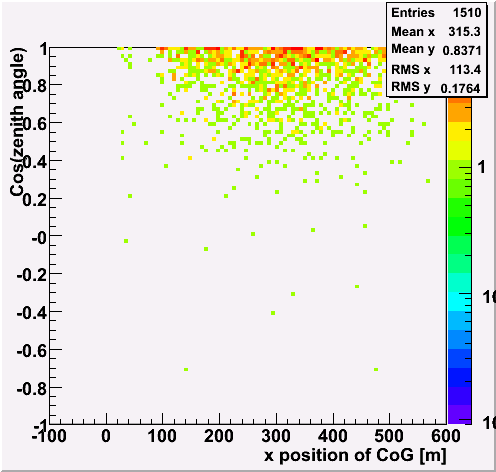
Zenith angle Vs CoG X.

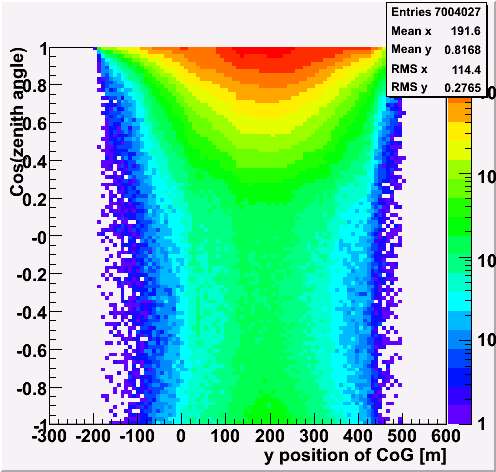
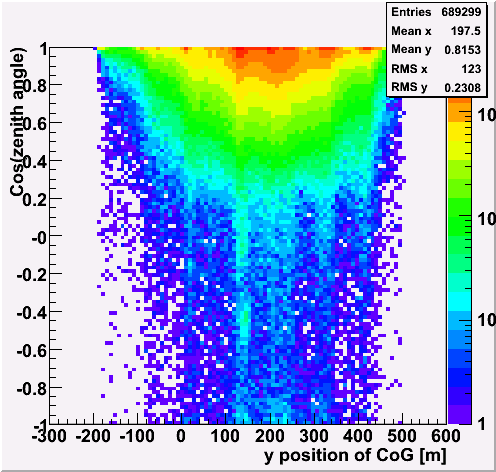
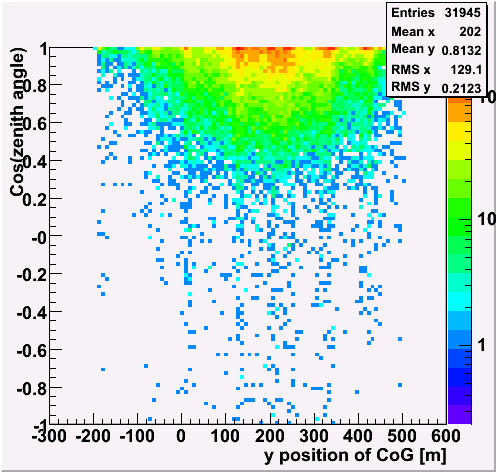
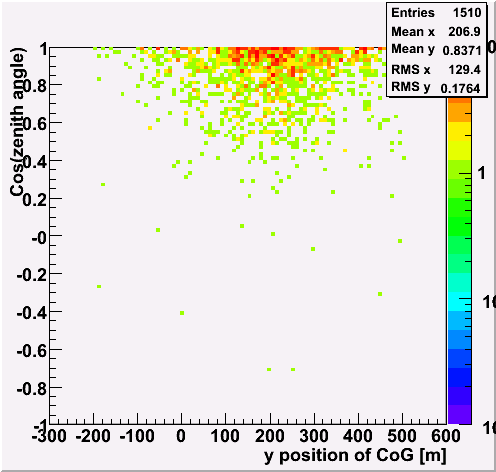
Zenith angle Vs CoG Y.

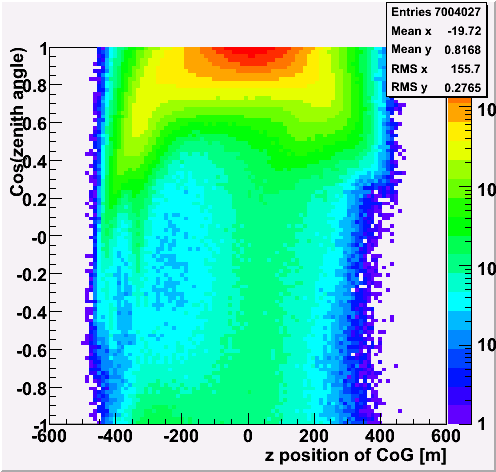
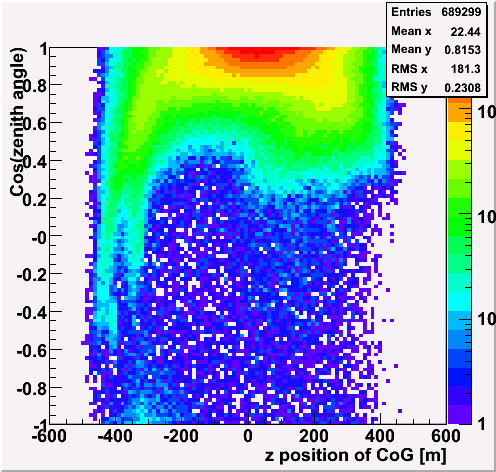
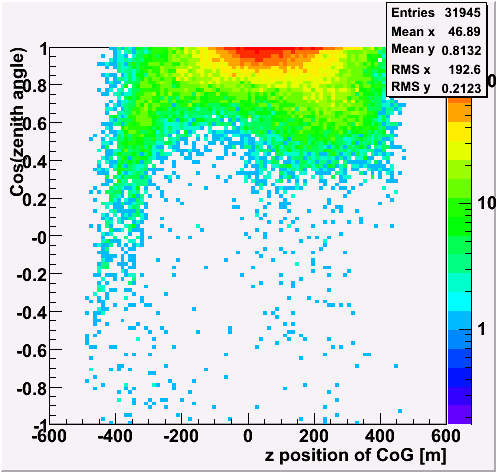
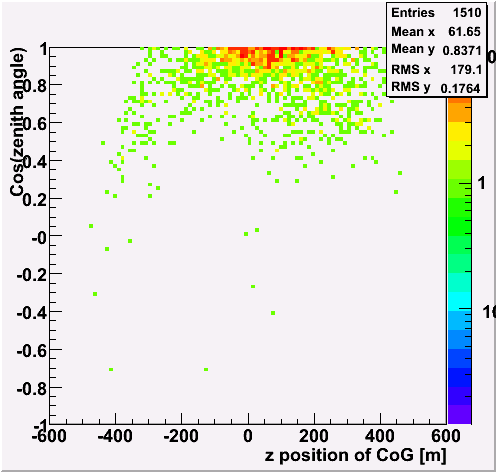
Zenith angle Vs CoG Z. You see some layers.

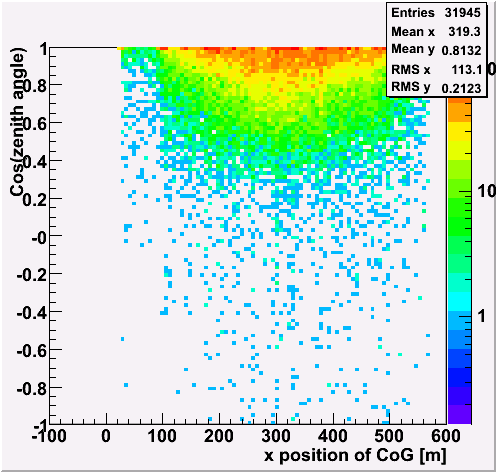
Zenith angle Vs CoG X. log10(total Npe)>3.. There is some blobs... I applied the low rate run cut here, but the results doesn't change.

Zenith angle Vs CoG Y. log10(total Npe)>3..

Zenith angle Vs CoG Z. log10(total Npe)>3..

Zenith angle Vs CoG X. log10(total Npe)>3.5.

Zenith angle Vs CoG Y. log10(total Npe)>3.5.

Zenith angle Vs CoG Z. log10(total Npe)>3.5.

Zenith angle Vs CoG X. log10(total Npe)>4.

Zenith angle Vs CoG Y. log10(total Npe)>4.

Zenith angle Vs CoG Z. log10(total Npe)>4.

3. Npe

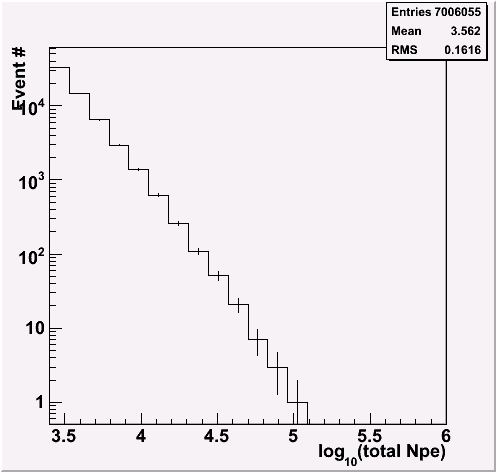
Total Npe

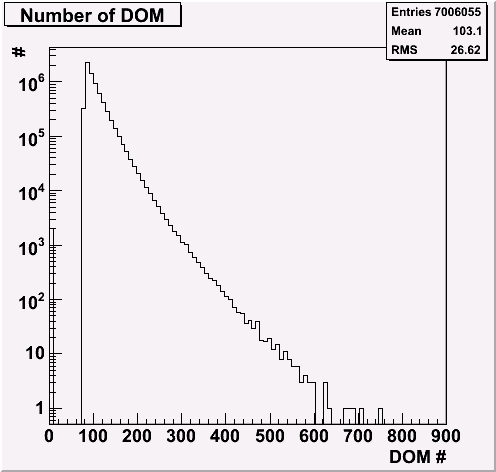
Hit DOM number

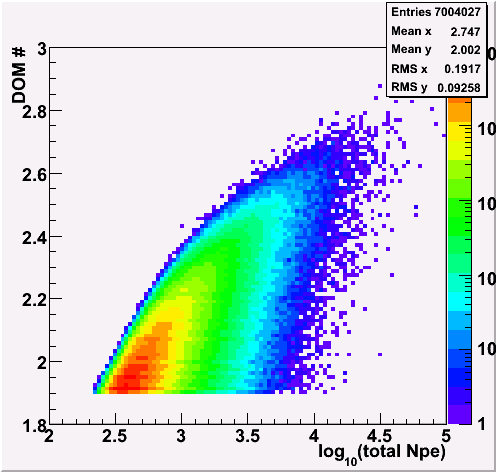
DOM number Vs total NPE

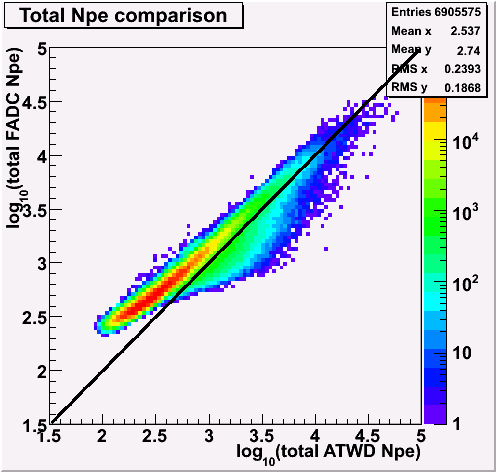
Total FADC Npe Vs total ATWD Npe

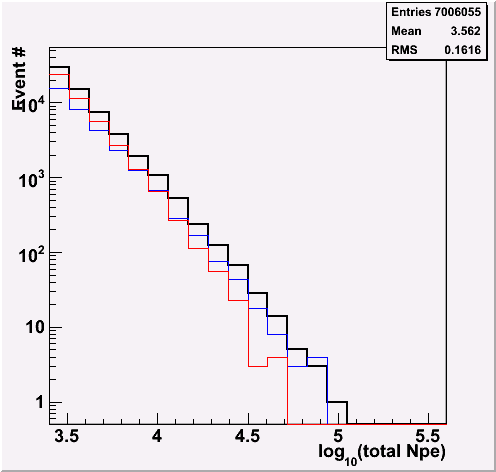
Npe distribution
black: total best Npe
blue: total ATWD Npe
red: total FADC Npe

4. MC comparison

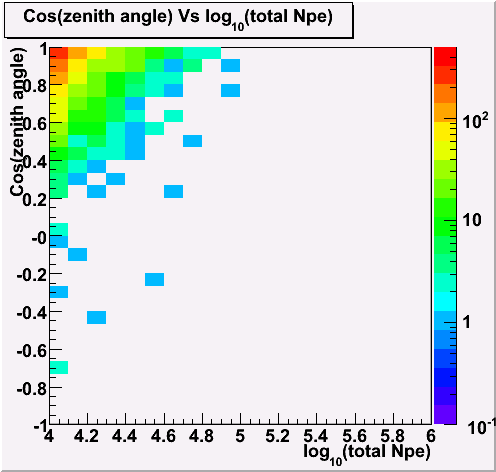
Cos(zenith angle) Vs log10(total Npe) (observational data (blinded))

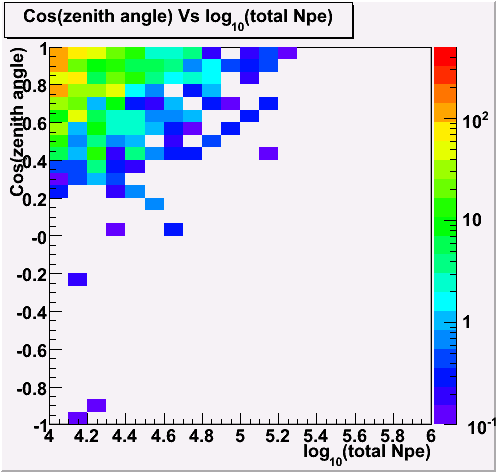
Cos(zenith angle) Vs log10(total Npe) (MC data)

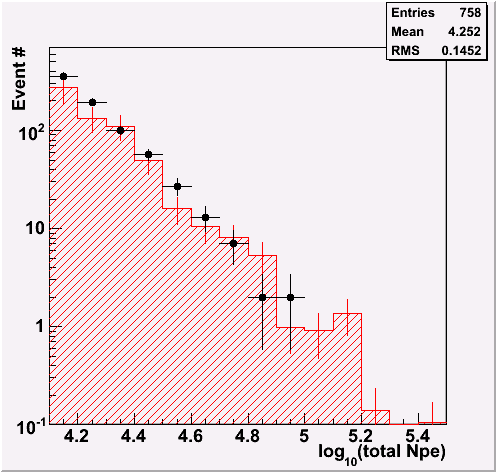
total Npe
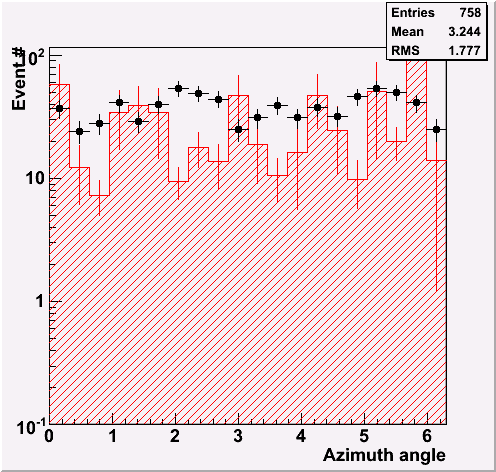
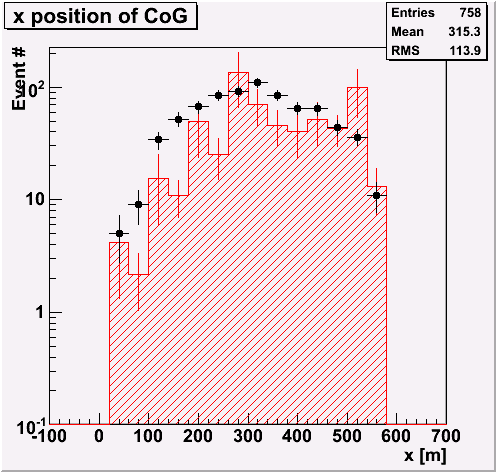
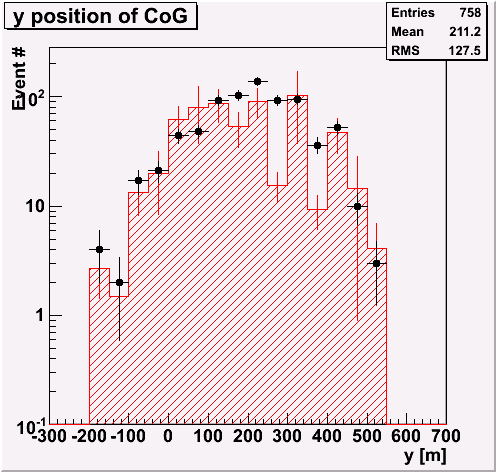
black: data
red: MC (model1: alpha:2.04, Eth:3730)

zenith angle (log10(Npe)>4.1)

azimuth angle (log10(Npe)>4.1)

x position of CoG (log10(Npe)>4.1)

y position of CoG (log10(Npe)>4.1)

z position of CoG (log10(Npe)>4.1)


Keiichi Mase
Last modified: Sat Nov 10 15:25:52 JST 2007