DOM Launch time check

Introduction
I found three peaks in the DOM launch time during the data check.
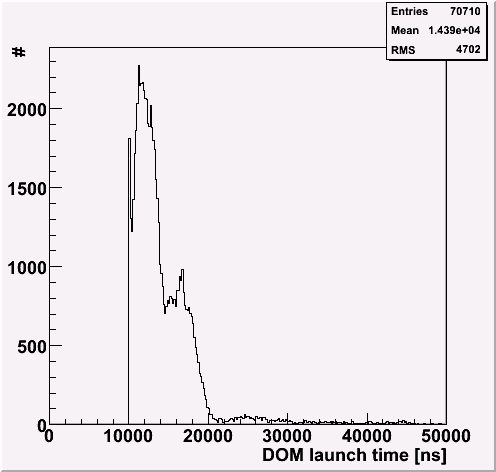
The second peak (about 6 micro sec later from the main peak)
is understood as the launch that had the first launch
but couldn't satisfy the local conincidence condition
(neighbor didn't got launched), so the first launch wasn't recorded.
Howerver, there is a third peak at around 25000 ns
Since I only plot here the first launch (the second or later was
cleaned by a procedure), the peak should not corresponds neither second
nor third launch.
Checking more
I then checked the 2nd launch or more, that are ignored in the previous
analysis. For this study, I only used data of run# 108981
(August 1st, 2007) (EHE filtered data (DOM#>80)).
In fact, I could not find any 3rd launch in the data.
|
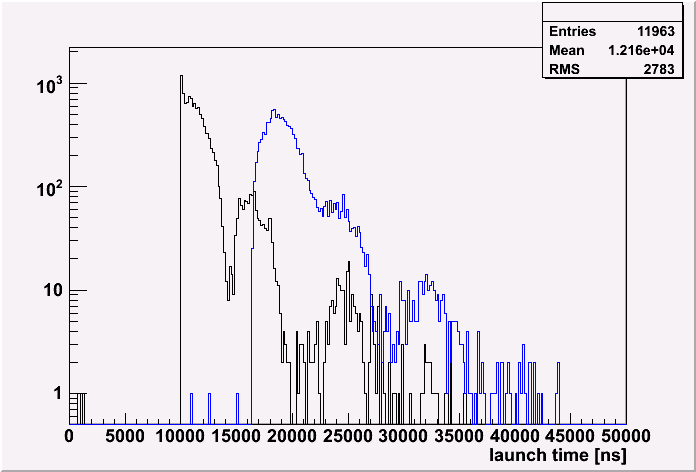
Launch time distributions for events that have 2 launches.
black: 1st launch
blue: 2nd launch
There are 3 peaks structure for the 2nd launch, too
The 2nd peak time of 1st launch doesn't match with the 1st peak
time of 2nd launch completely.
|
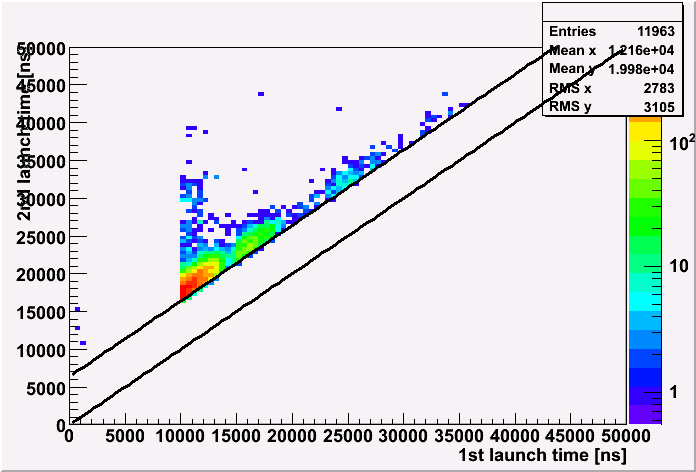
Correlation between the first and the second launch
for events that have two launches.
Functions of y=x and y=x+6400 are plotted.
There are clear correlations between peaks of the 1st and 2nd
launch time.
You see also a clear 6.4 micro sec delay.
|
These results are consistent with the hypothisis of that
the 2nd peak is due to DOMs that launched but didn't have
neighbors to satisfy the local coincidence condition.
However, I don't know how the 3rd peak is formed.
The 3rd peak
In order to know the nature of the 3rd peak, I plotted the position
of DOMs for 3rd peak.
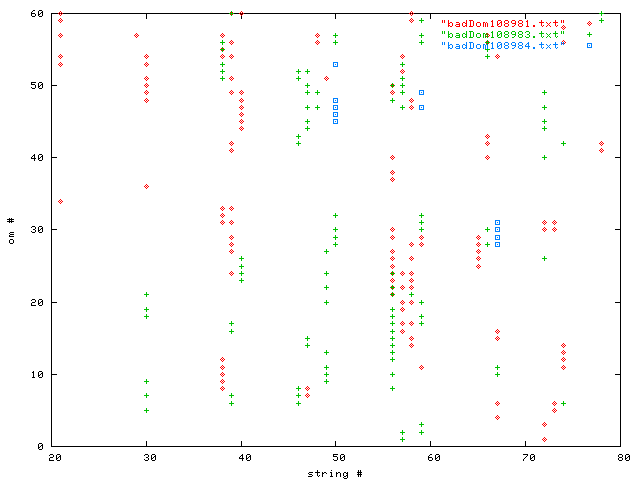
You see that the 3 peak events are correlated in a string.
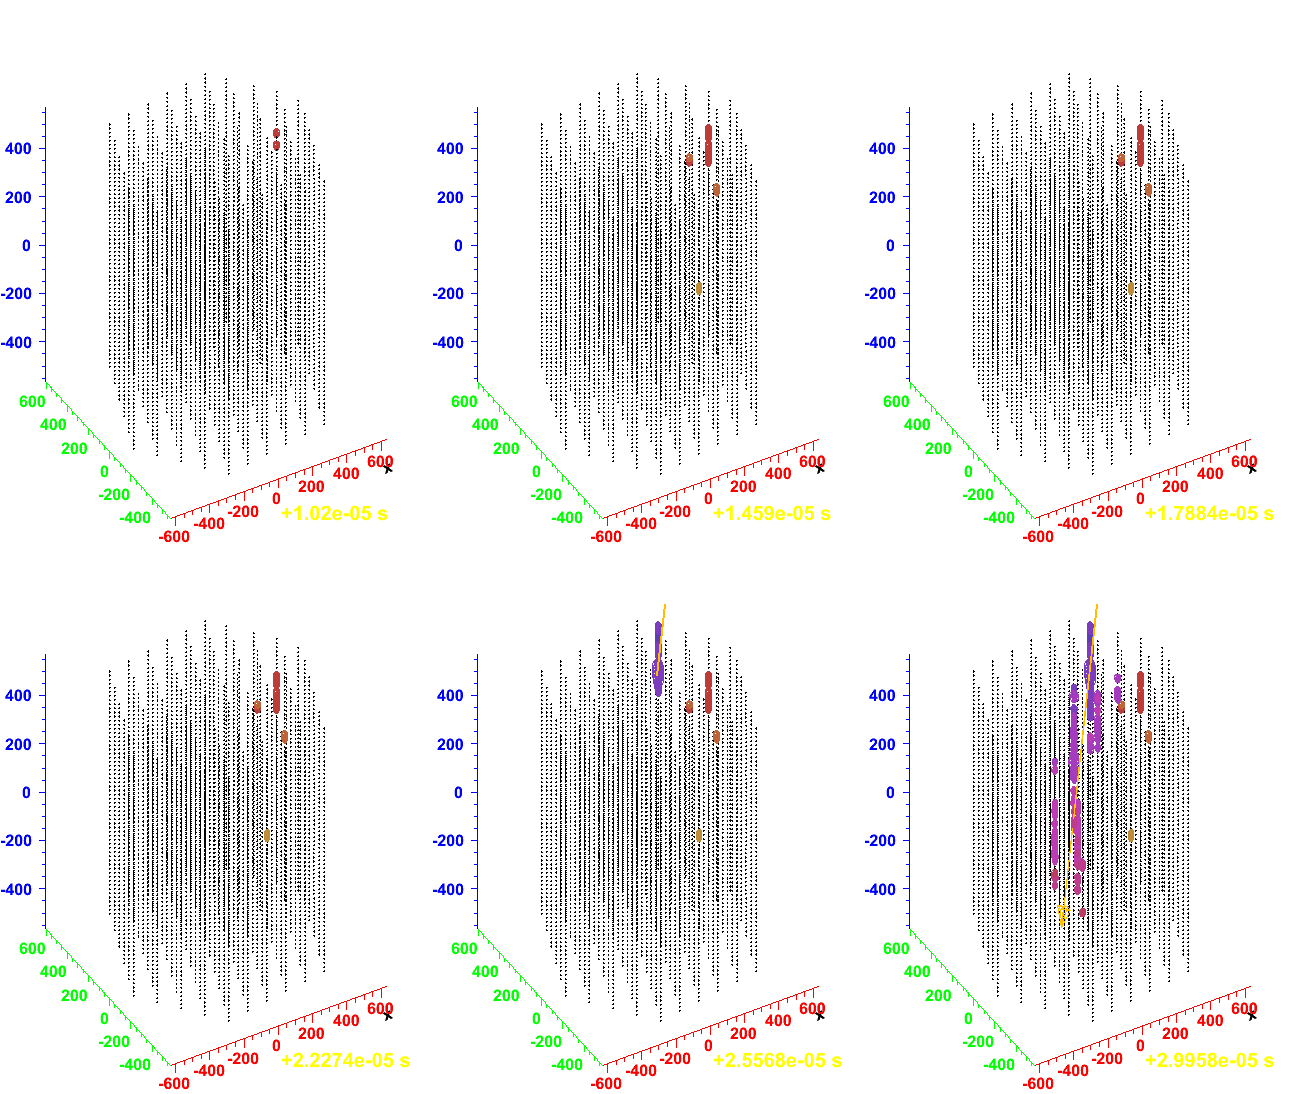
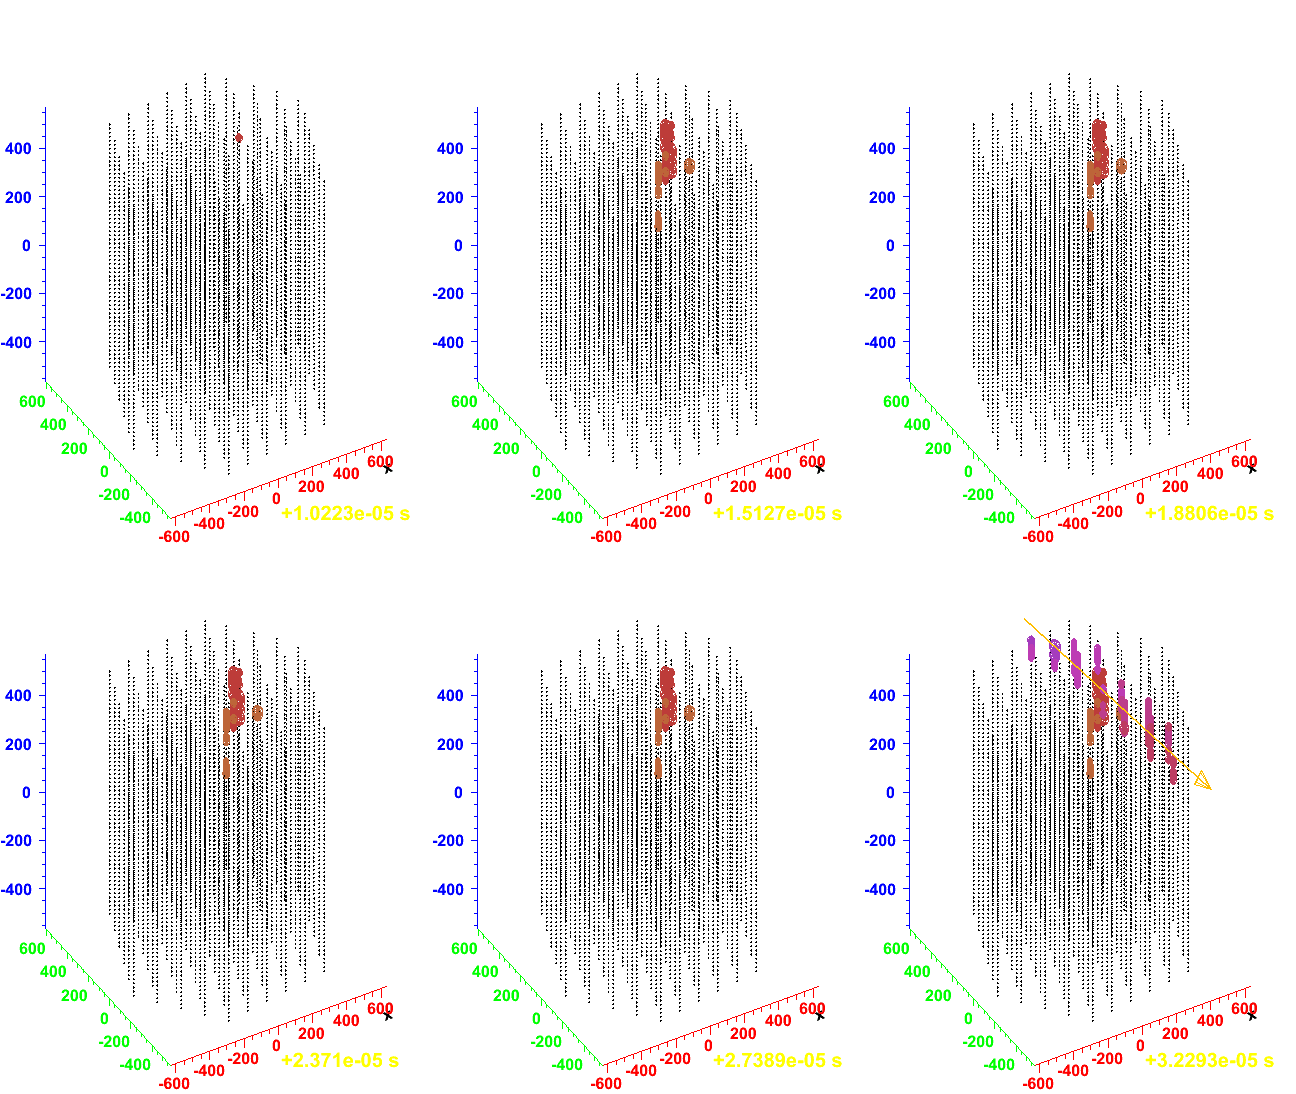
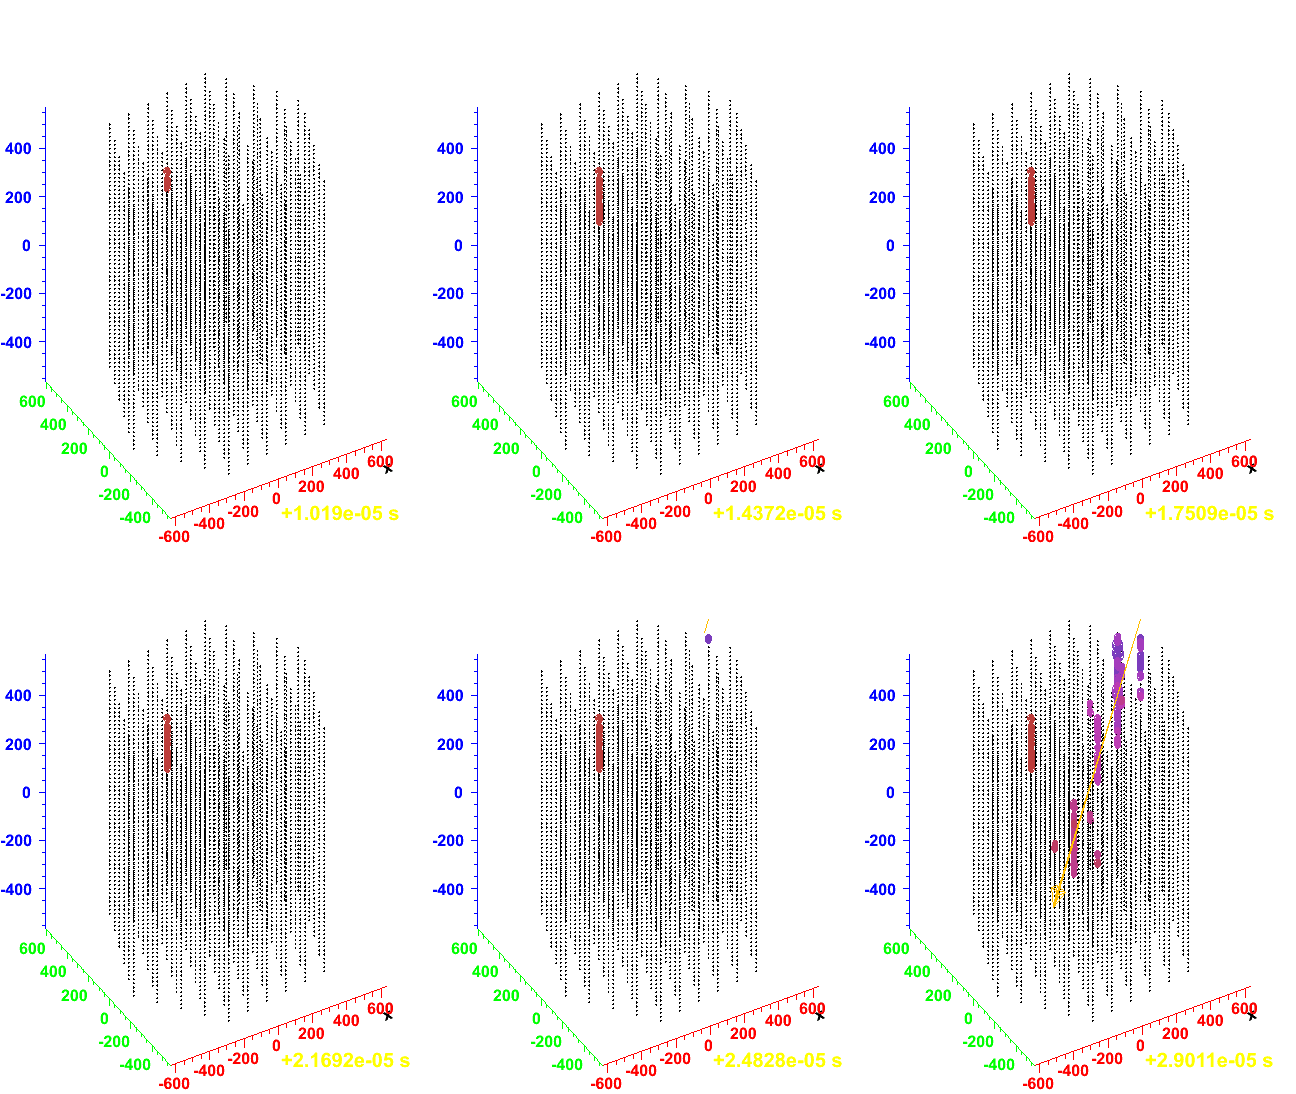
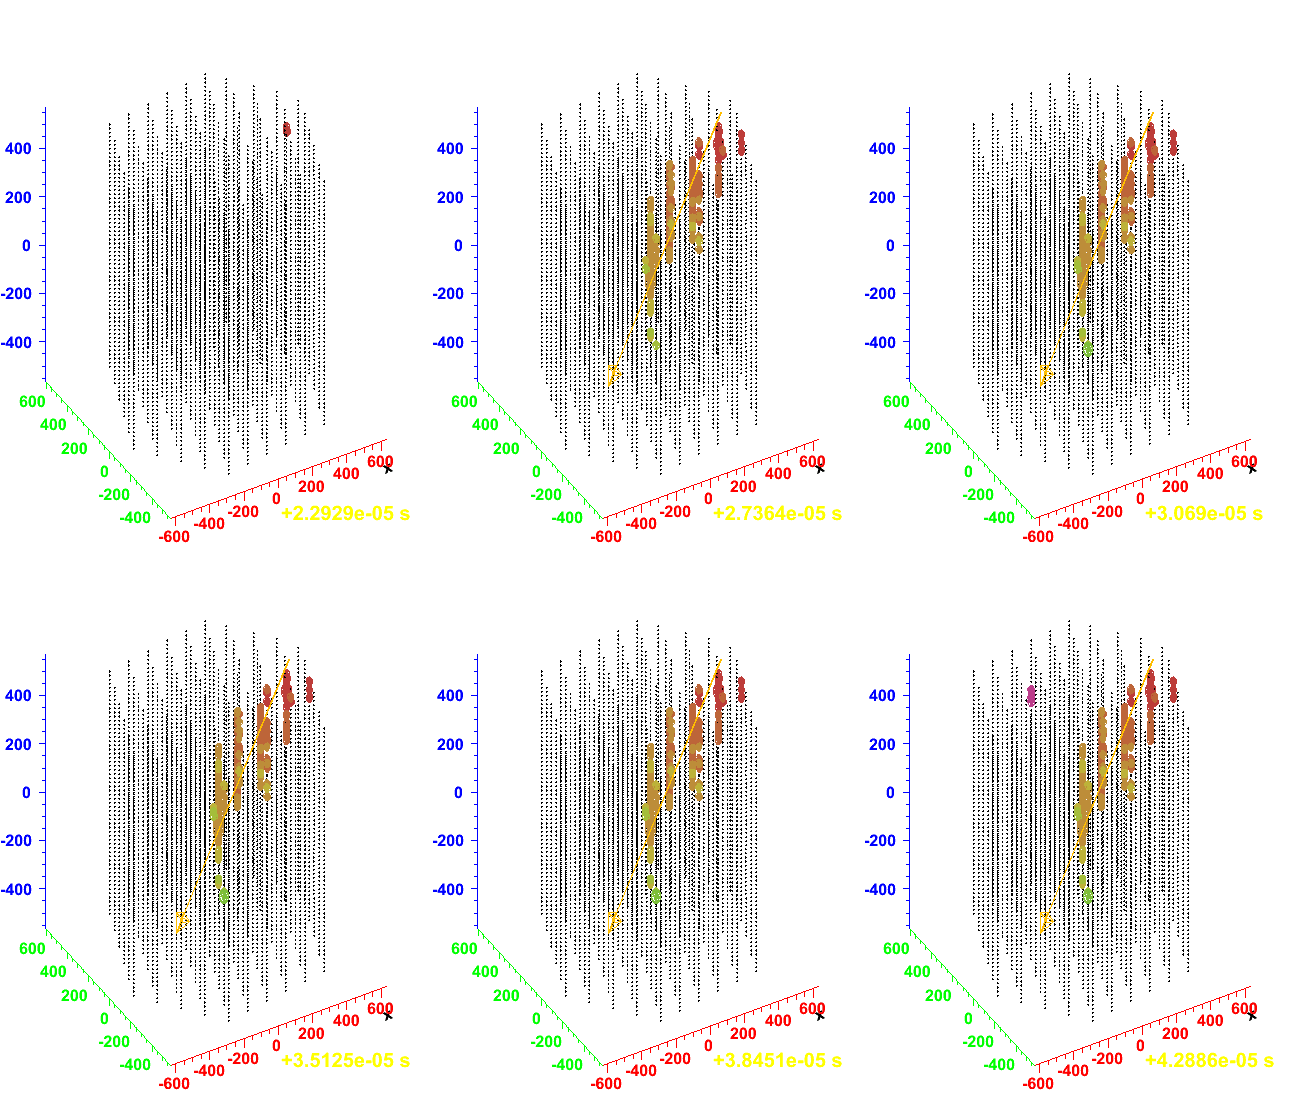
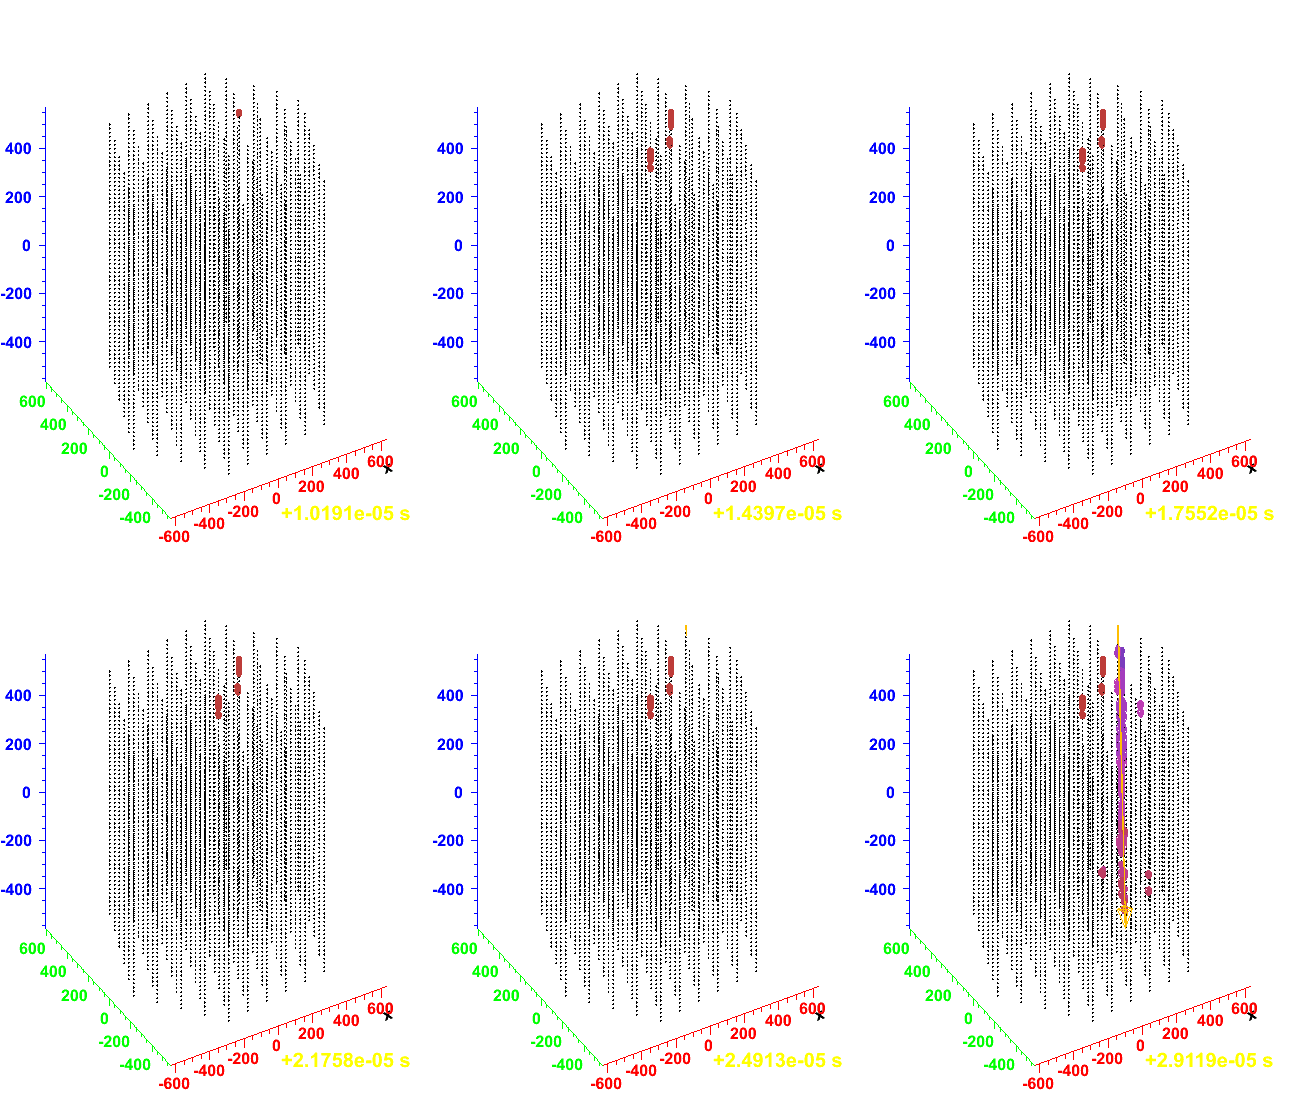
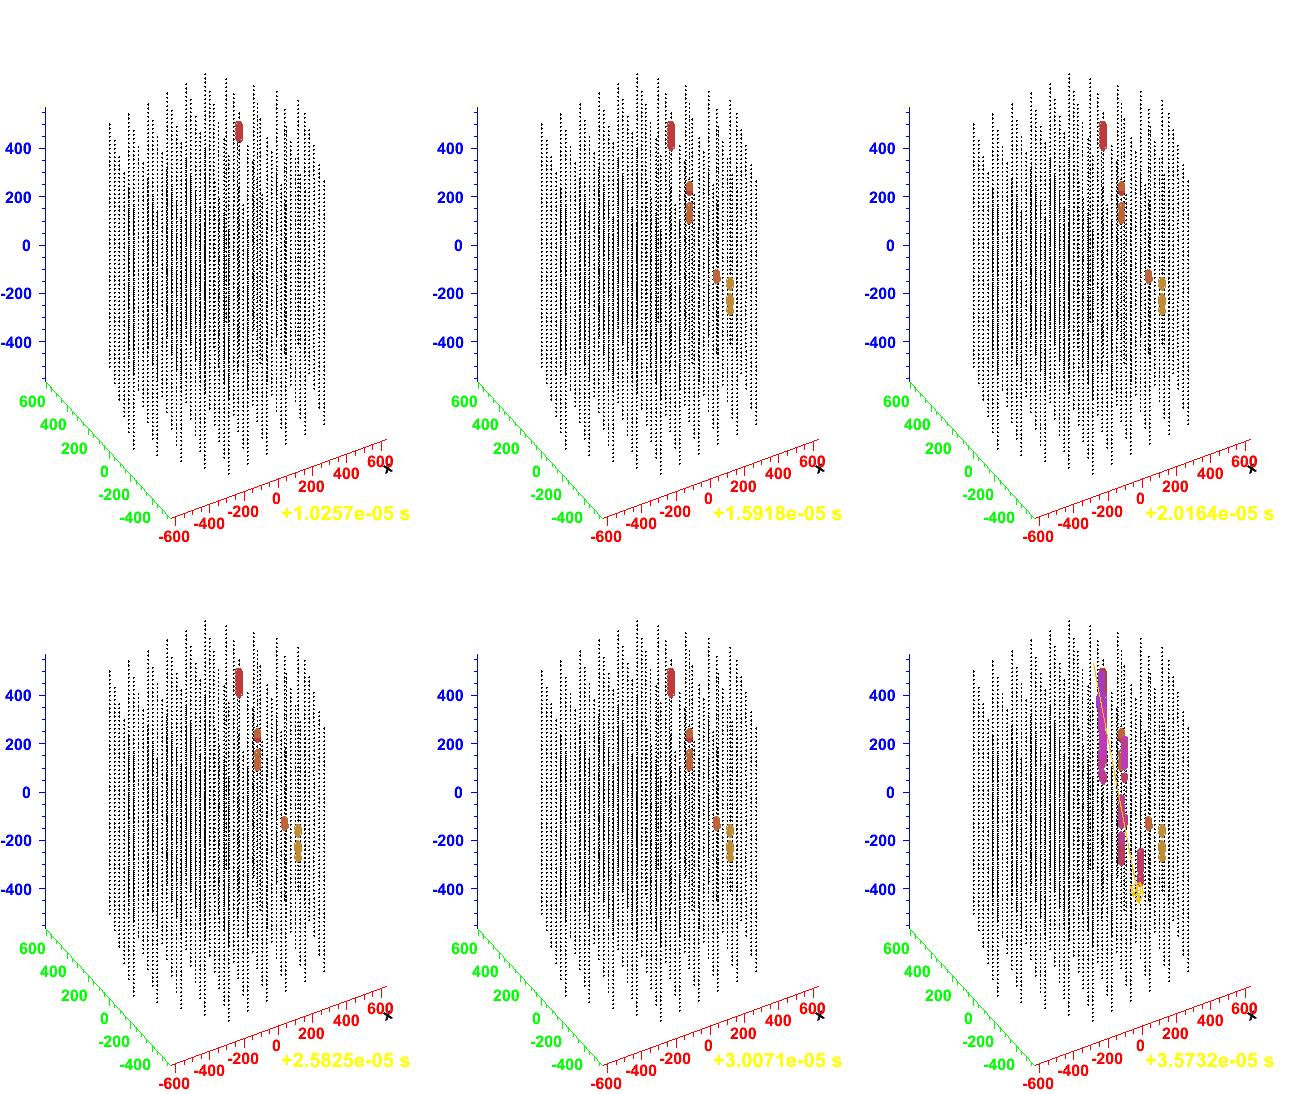
I also checked those events by the event-viewer, taking those events randomly.
|
Run#: 108981, ID: 43173
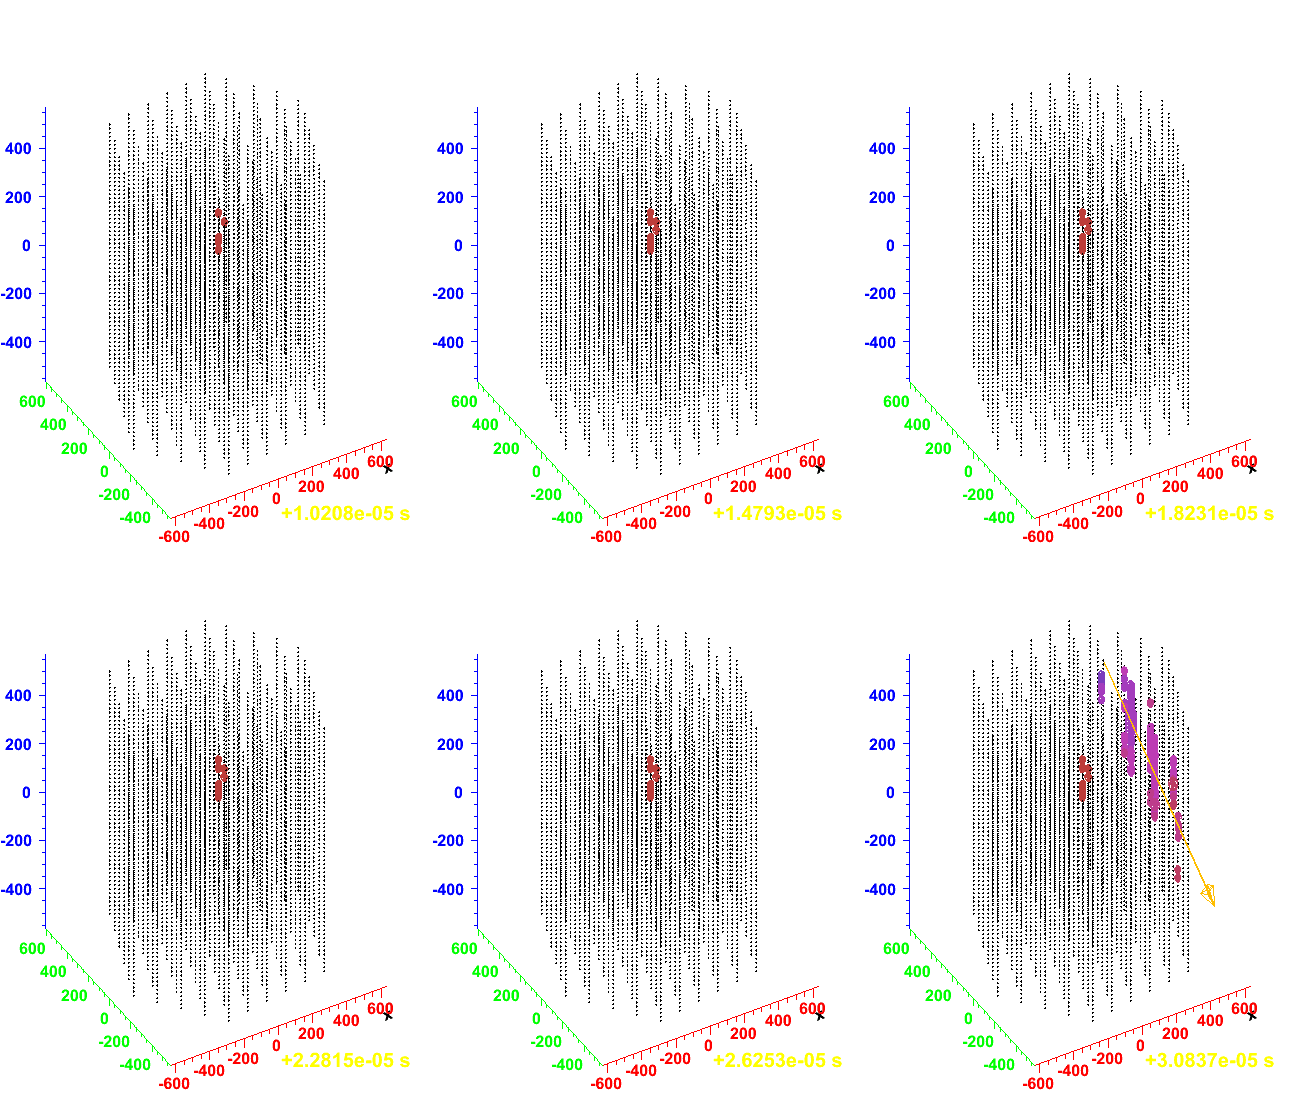
|
Run#: 108981, ID: 64704
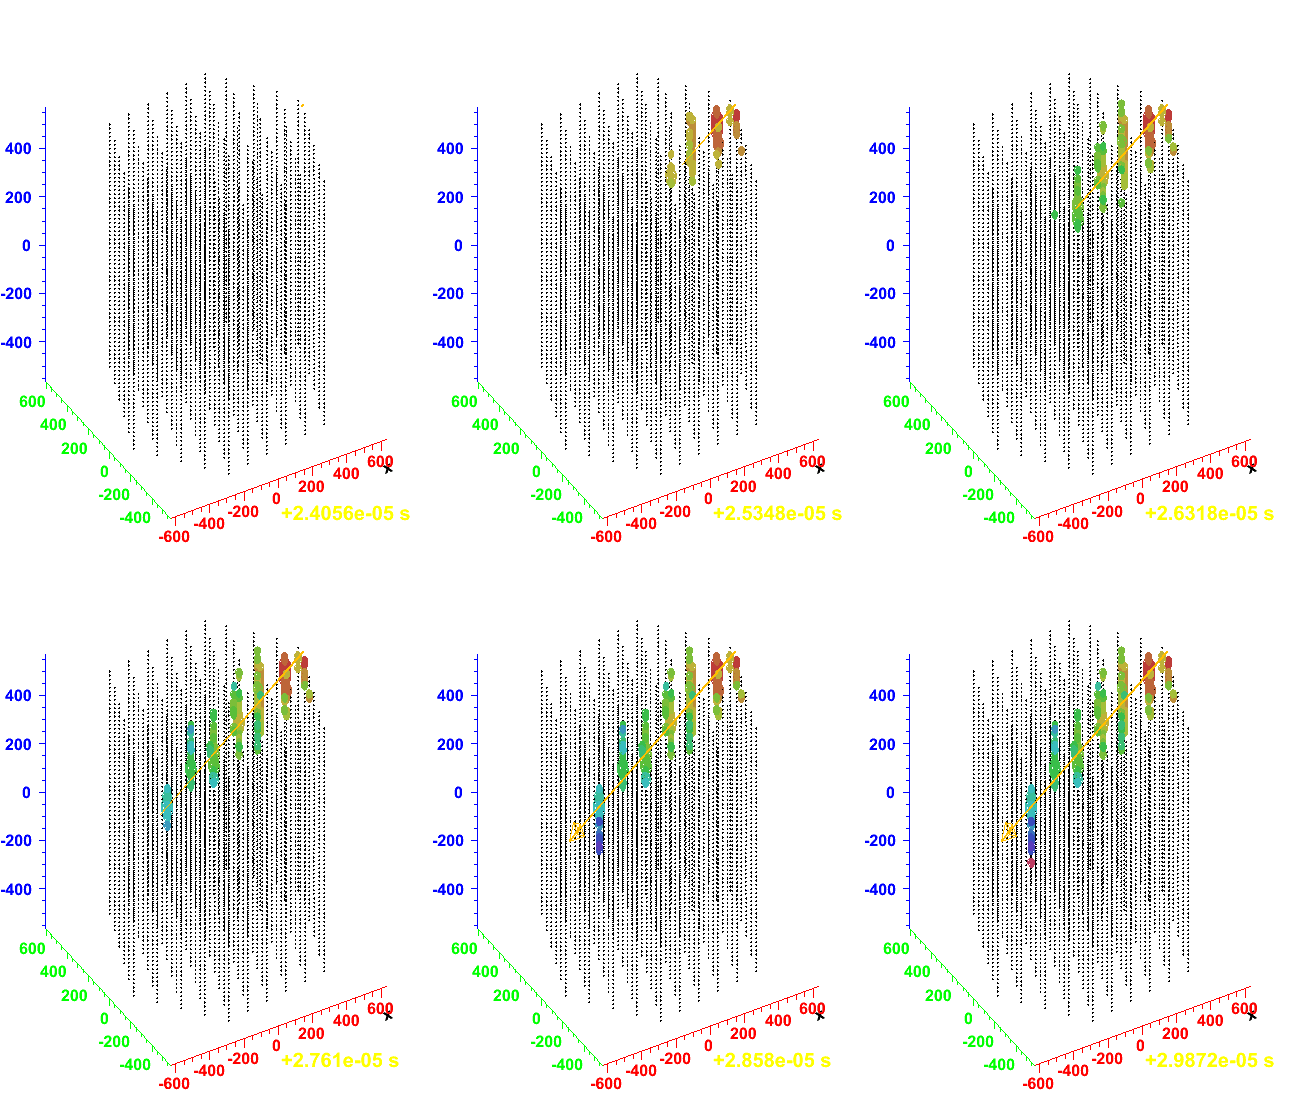
|
|
Run#: 108981, ID: 125411
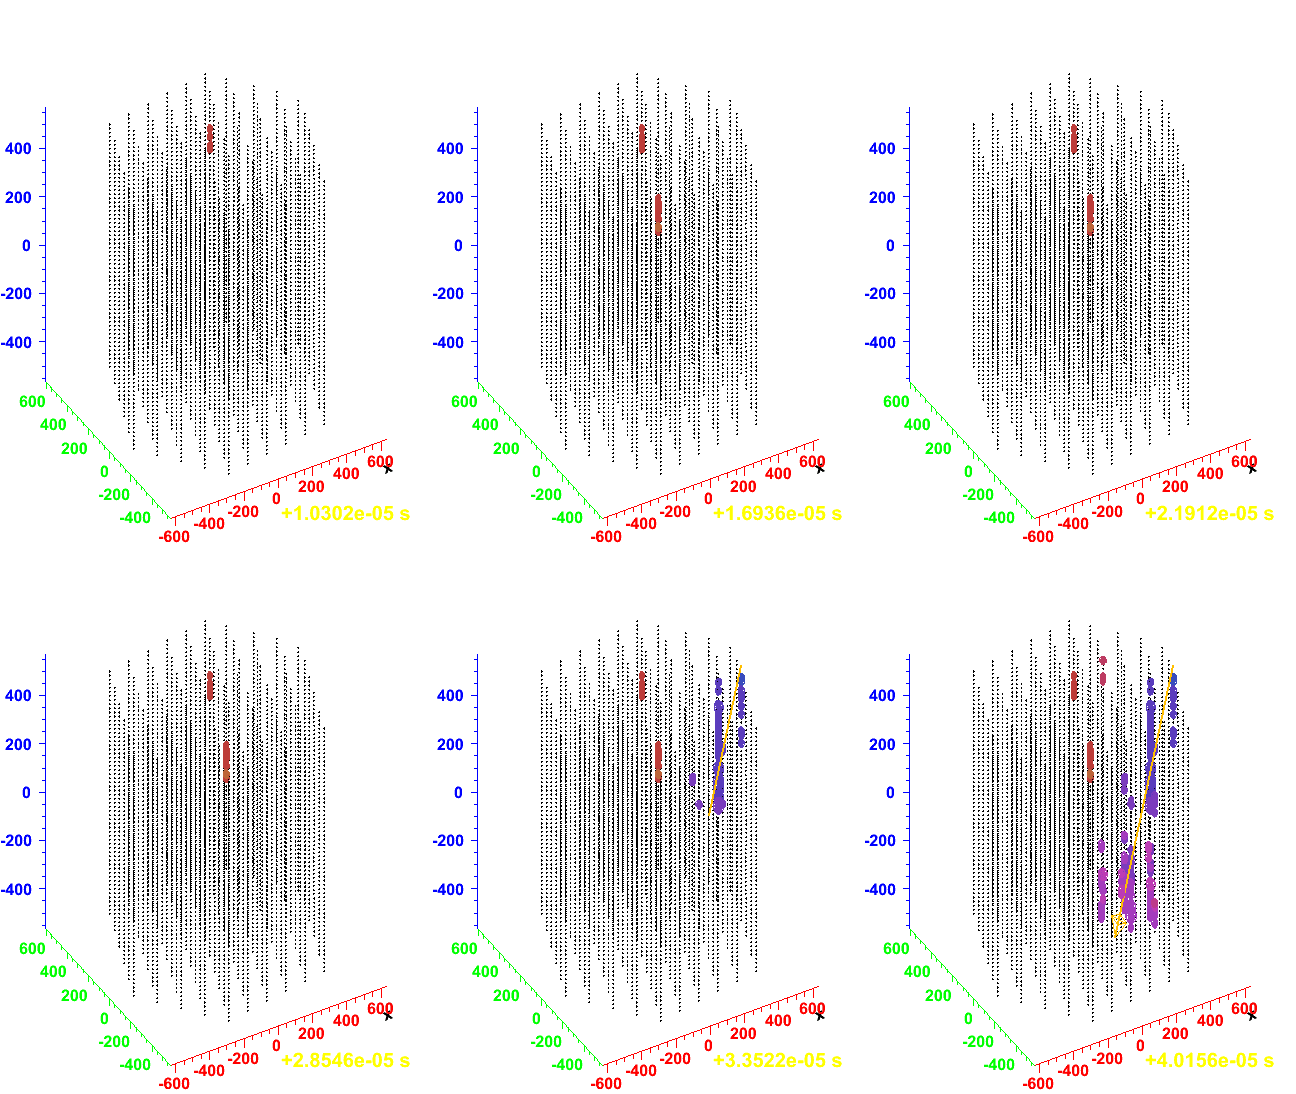
|
Run#: 108981, ID: 240136
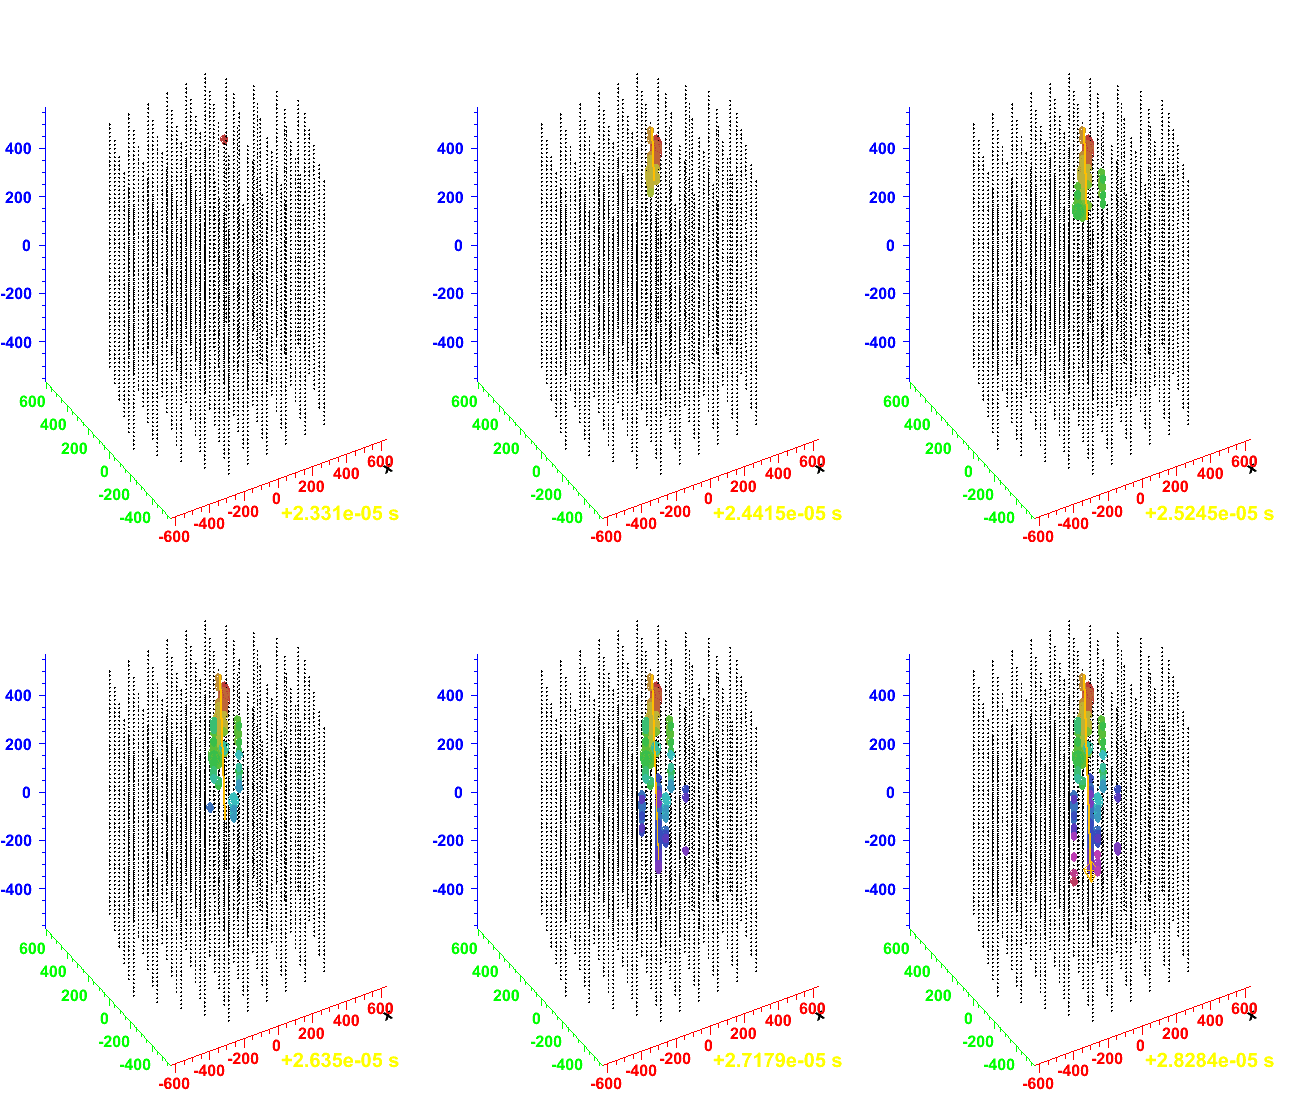
|
|
Run#: 108981, ID: 247122
|
Run#: 108981, ID: 285772
|
|
Run#: 108981, ID: 293385
|
Run#: 108981, ID: 309474
|
|
Run#: 108981, ID: 342062
|
Run#: 108981, ID: 432692
|
At first, those events are related to physical events and not just
noises.
Some of those events looks quite OK. Most of them looks double
coincident events, though the first event looks smaller than the
following one (can be due to low statistics). I am not 100% sure
this early coming events are really physical one. This can be noise.
(cross-talk?) I also don't understand why those events make the 3rd peak
in launch time if they are really double coincident events.
Comments are welcome!

Keiichi Mase
Last modified: Sat Nov 10 15:25:52 JST 2007


