|
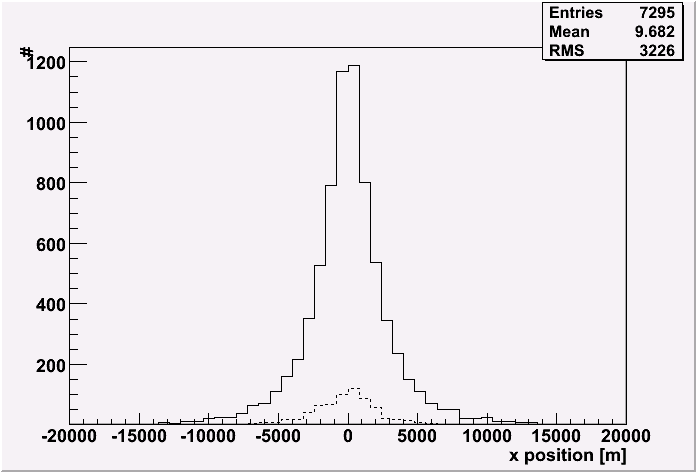
x position of the primary particle at the surface.
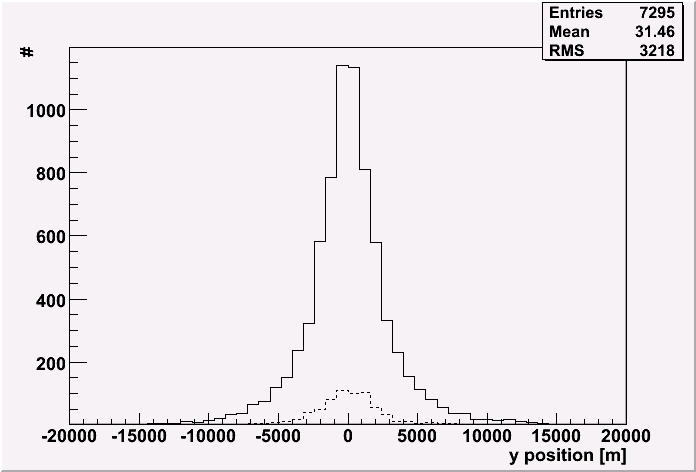
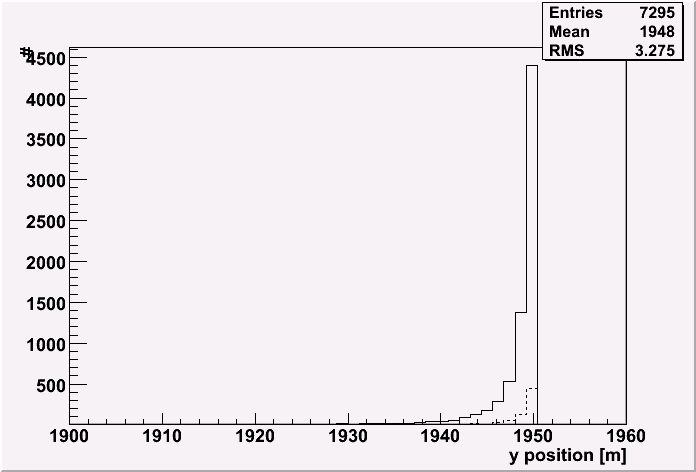
Dot line represents events whose hit DOM is above 80.
(high energy events)
|
y position of the primary particle at the surface.
|
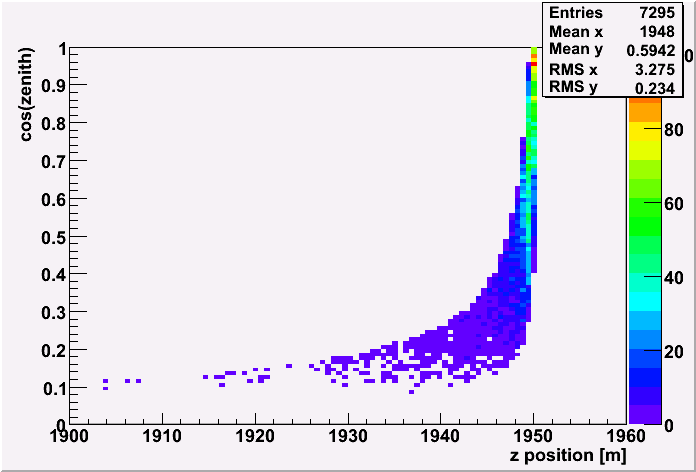
z position of the primary particle at the surface.
|
|
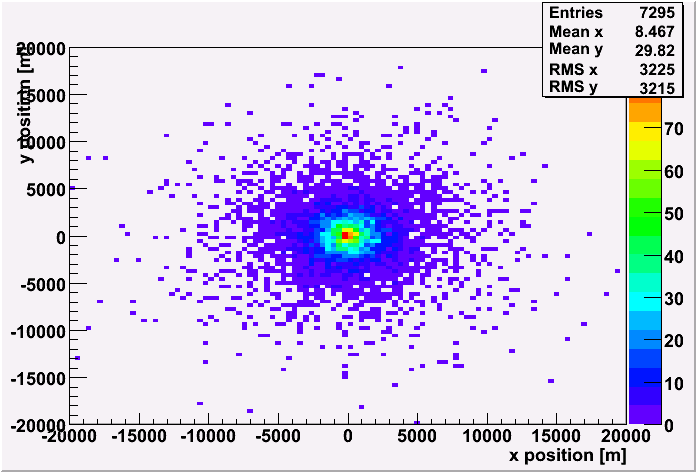
x-y position of the primary particle at the surface.
|
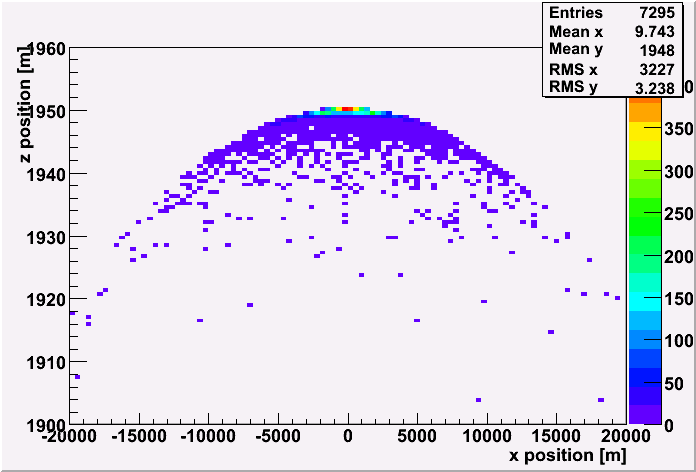
x-z position of the primary particle at the surface.
|
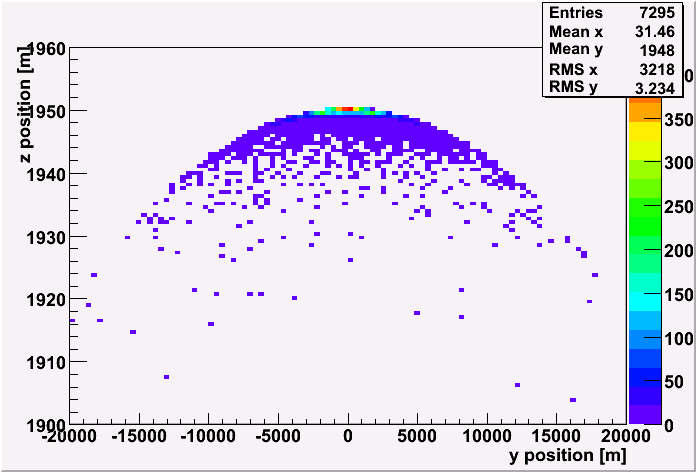
y-z position of the primary particle at the surface.
|
|
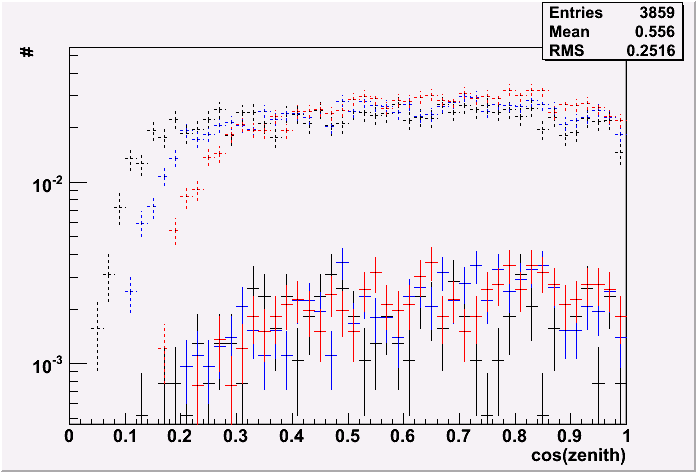
cos(zenith angle) of the primary particle.
Dot line represents events whose hit DOM number above 80.
(high energy events)
|
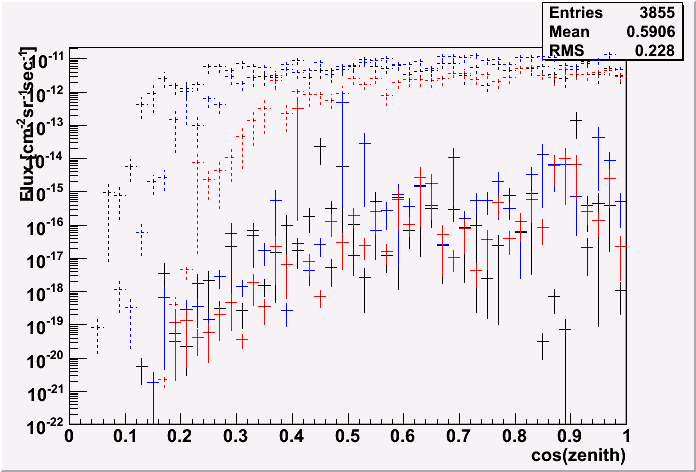
cos(zenith angle) of the primary particle weighted by hte CR flux.
Dot line represents events whose hit DOM number above 80.
(high energy events)
|
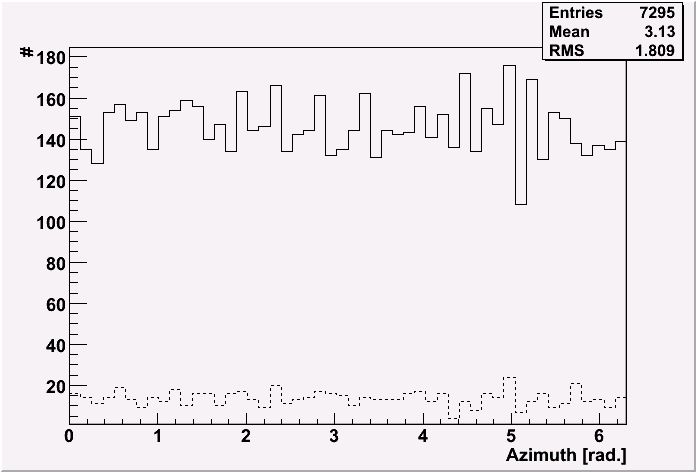
azimuth angle of the primary particle.
|
|
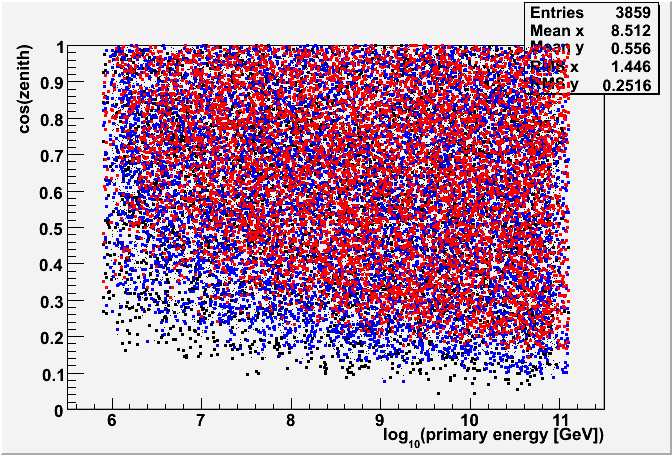
cos(zenith angle) of the primary particle Vs the energy.
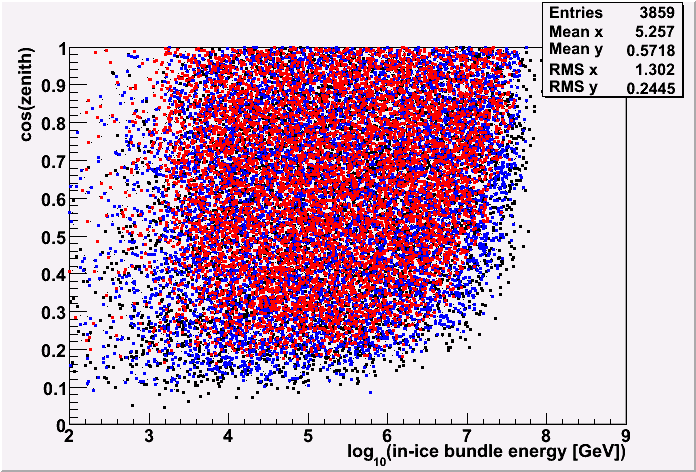
Black: ECUTS thres 500 GeV
Blue: ECUTS thres 1 TeV
Red: ECUTS thres 2 TeV
|
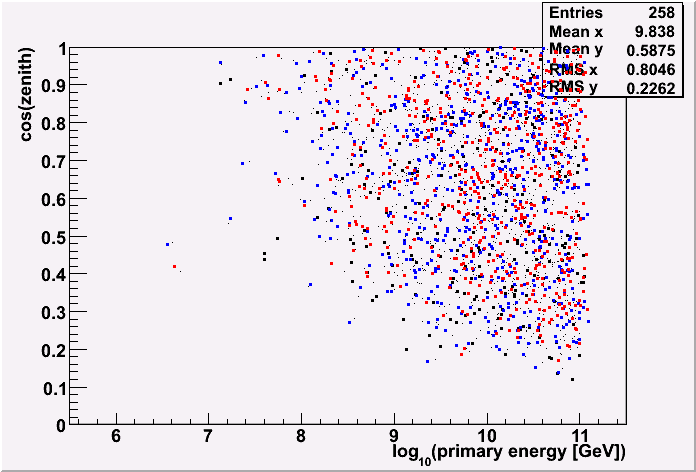
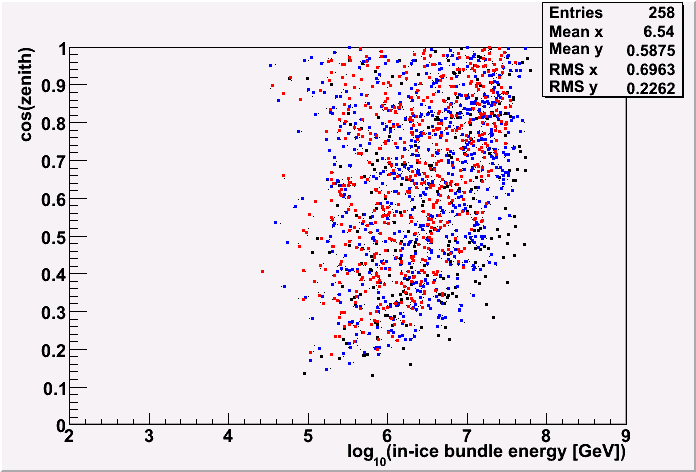
cos(zenith angle) of the primary particle Vs the energy with a cut of DOM# > 80.
Black: ECUTS thres 500 GeV
Blue: ECUTS thres 1 TeV
Red: ECUTS thres 2 TeV
|
|
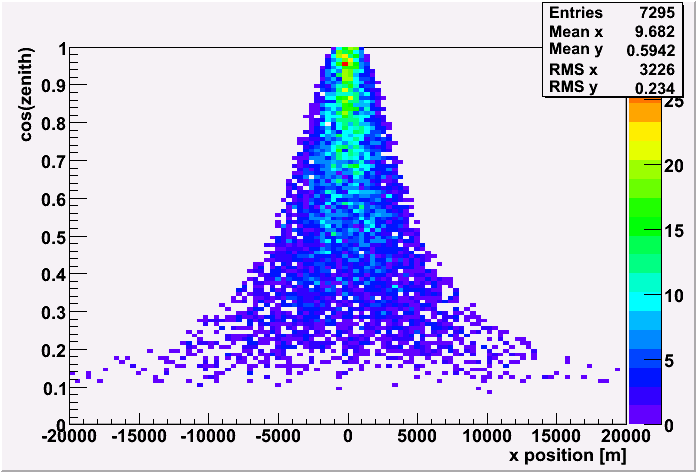
azimuth angle of the primary particle.
|
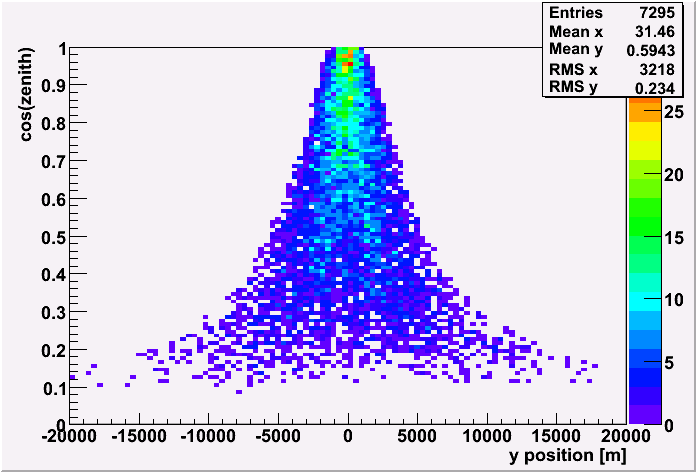
cos(zenith angle) of the primary particle.
|
azimuth angle of the primary particle.
|
|
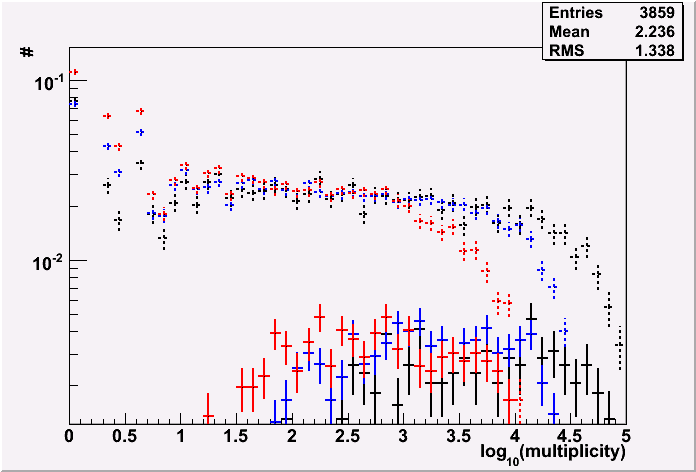
Multiplicity of muons
Black: ECUTS thres 500 GeV
Blue: ECUTS thres 1 TeV
Red: ECUTS thres 2 TeV
Dot line: without cut
normal line: with DOM#>80
|
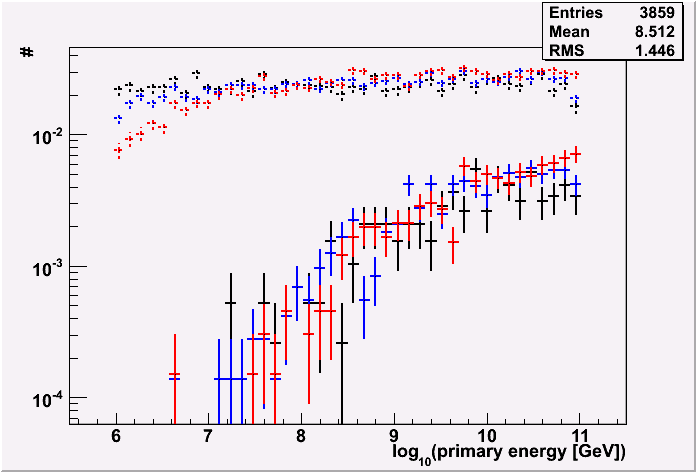
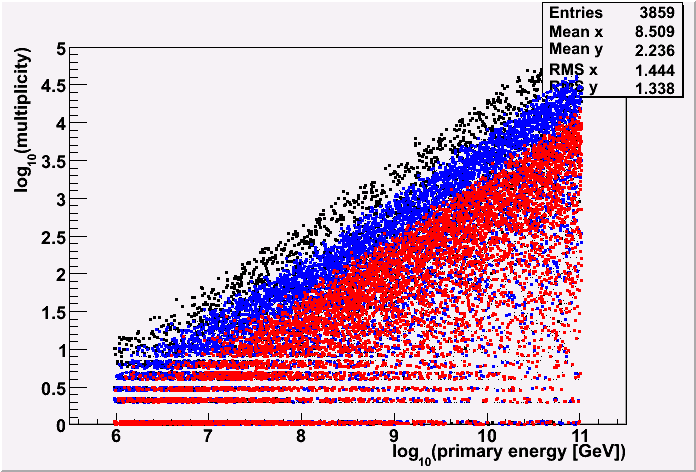
Multiplicity Vs primary energy
Black: ECUTS thres 500 GeV
Blue: ECUTS thres 1 TeV
Red: ECUTS thres 2 TeV
|
|
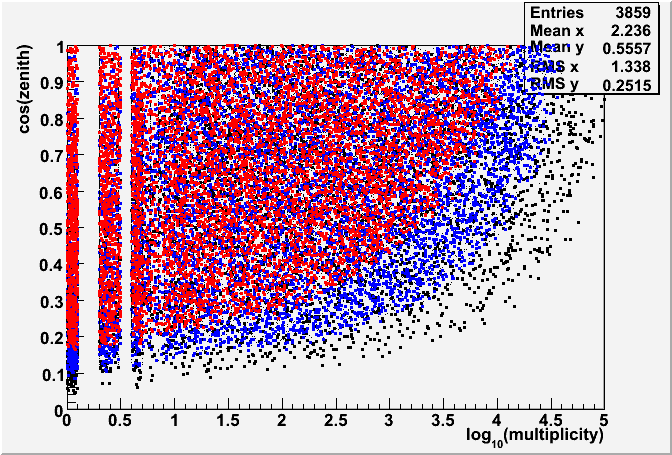
cos(Zenith angle) Vs Multiplicity of muons
Black: ECUTS thres 500 GeV
Blue: ECUTS thres 1 TeV
Red: ECUTS thres 2 TeV
|
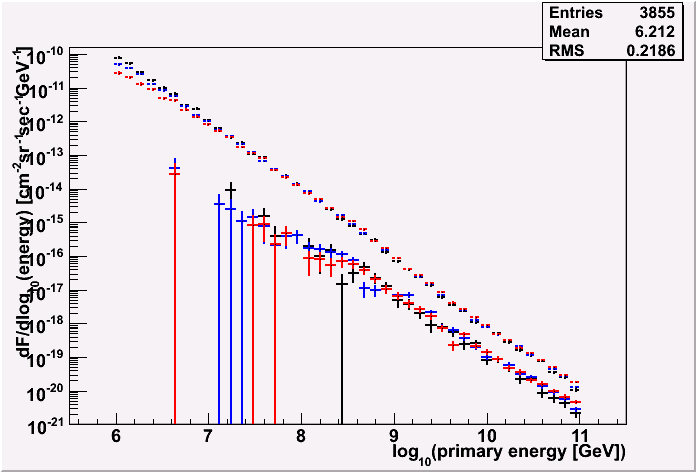
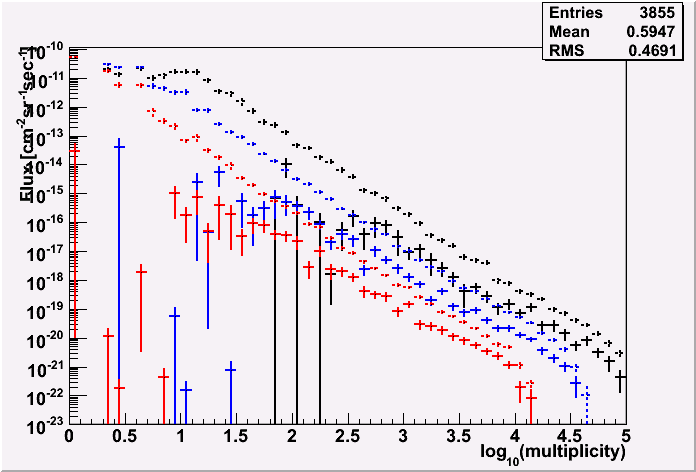
Multiplicity of muons weighted by the CR
Black: ECUTS thres 500 GeV
Blue: ECUTS thres 1 TeV
Red: ECUTS thres 2 TeV
Dot line: without cut
normal line: with DOM#>80
|
|
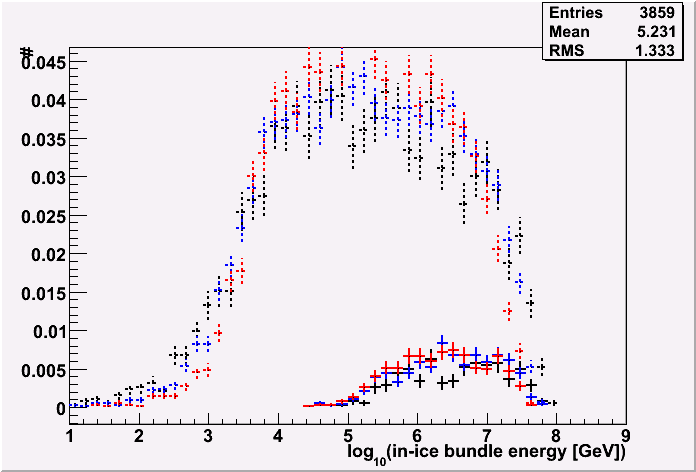
Energy distribution at IceCube detector (in ice)
Black: ECUTS thres 500 GeV
Blue: ECUTS thres 1 TeV
Red: ECUTS thres 2 TeV
Dot line: without cut
normal line: with DOM#>80
Even though the statistics may not be enough, I would say
ECUTS of 1 TeV is fine.
|
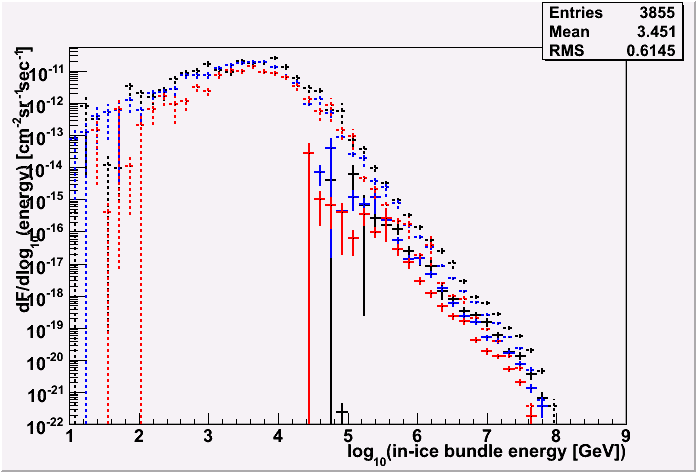
Energy distribution at IceCube detector (in ice) weighted by the CR flux
Black: ECUTS thres 500 GeV
Blue: ECUTS thres 1 TeV
Red: ECUTS thres 2 TeV
Dot line: without cut
normal line: with DOM#>80
|
|
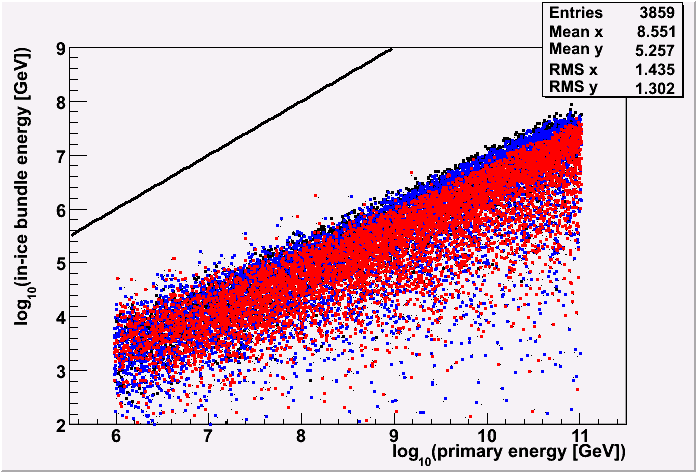
Energy in ice Vs primary energy
You may be convinced that the EUCTS of 1 TeV (blue dots) is
fine to use.
|
cos(zenith angle) Vs energy in ice
|
cos(zenith angle) Vs energy in ice with a cut of #DOM > 80
|
|
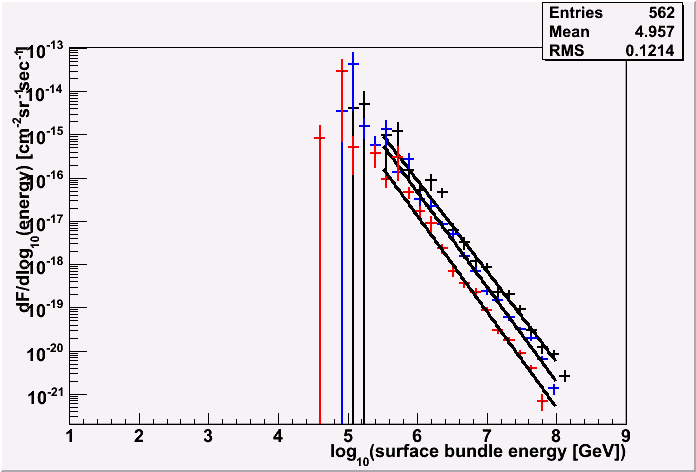
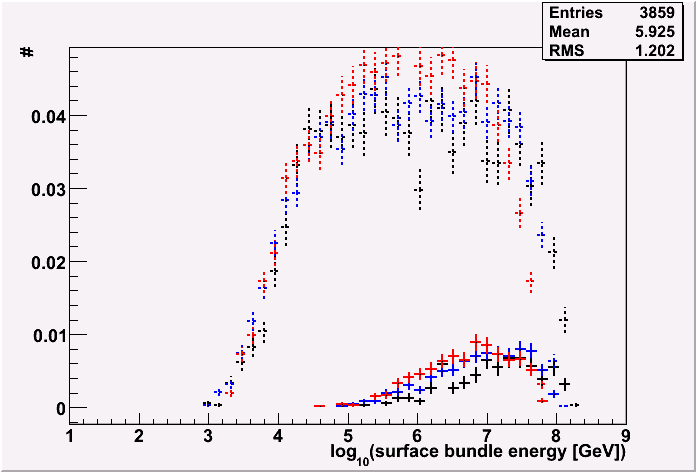
Energy distribution at surface
Black: ECUTS thres 500 GeV
Blue: ECUTS thres 1 TeV
Red: ECUTS thres 2 TeV
Dot line: without cut
normal line: with DOM#>80
Even though the statistics may not be enough, I would also
say ECUTS of 1 TeV is fine.
|
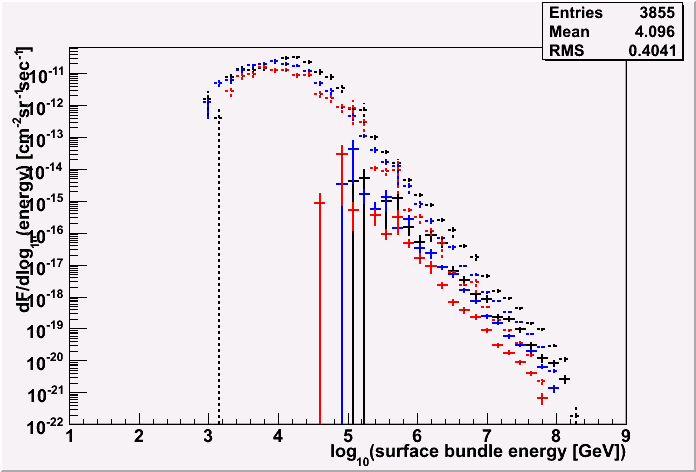
Energy distribution at surface weighted by the CR flux
Black: ECUTS thres 500 GeV
Blue: ECUTS thres 1 TeV
Red: ECUTS thres 2 TeV
Dot line: without cut
normal line: with DOM#>80
|
|
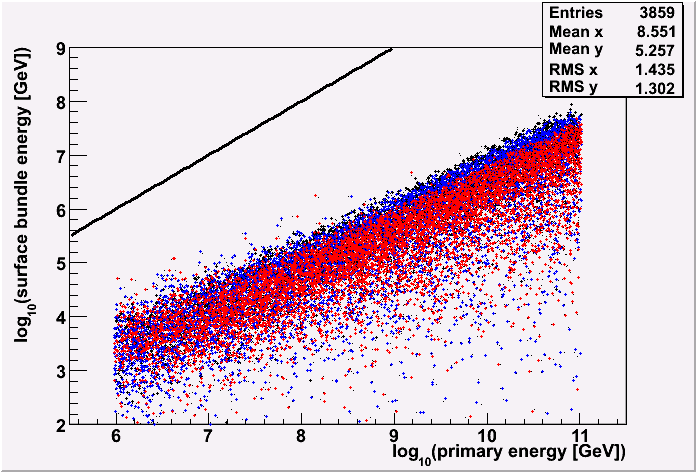
Energy at surface Vs primary energy
You may be convinced that the EUCTS of 1 TeV (blue dots) is
fine to use.
|
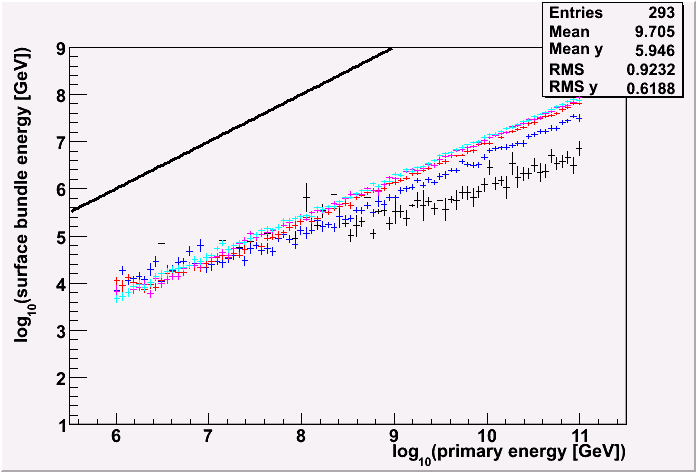
Energy at surface Vs energy in ice
The zenith angle dependence
Black: cos(zenith angle) < 0.2
Blue: 0.2 < cos(zenith angle) < 0.4
Red: 0.4 < cos(zenith angle) < 0.6
Magenda: 0.6 < cos(zenith angle)< 0.8
Water: 0.8 < cos(zenith angle) < 1.0
Horizontal particles loose the energy at high energy.
This is probably due to limited simulation volume (880m radius),
but I think this is
fine because those particles beyond the volume will not make so many
photons that can reach our detector, but I will check this more.
|
|
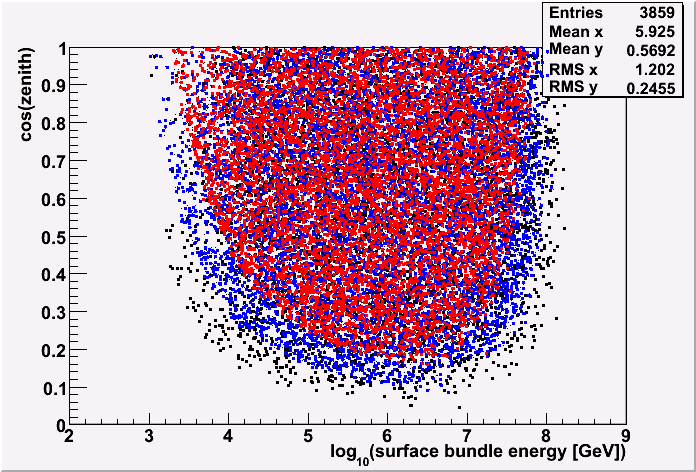
cos(zenith angle) Vs energy at surface
|
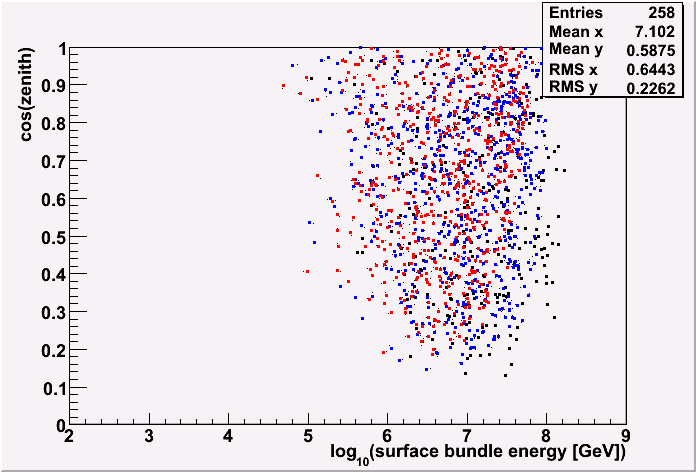
cos(zenith angle) Vs energy at surface with a cut of #DOM > 80
|
|
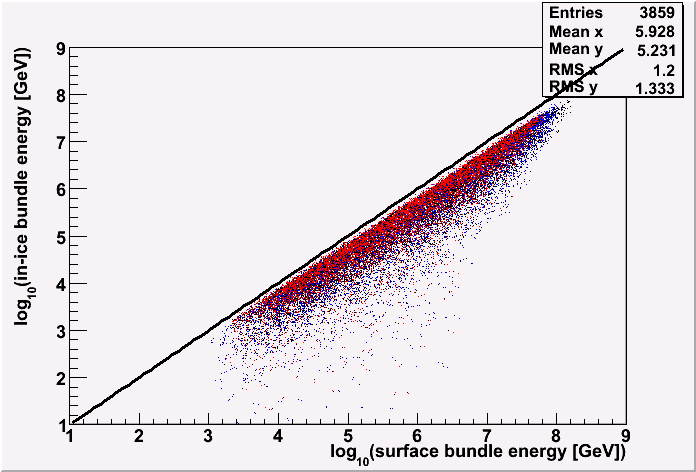
Energy at surface Vs energy in ice
There is a constant energy loss during the propagation
from surface to the detector (~log10(0.2)~30%)
|
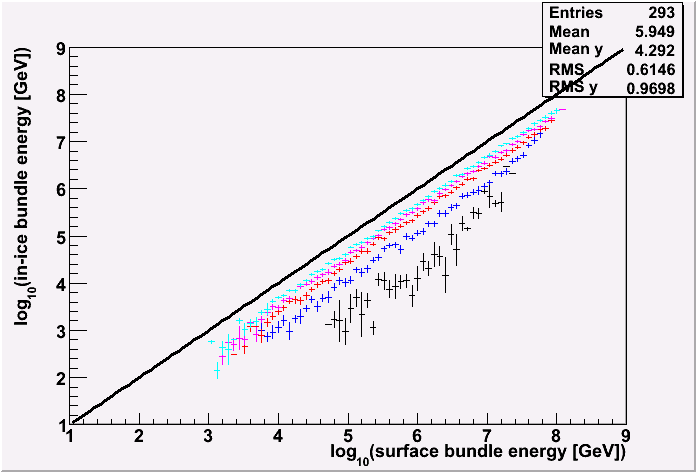
Energy at surface Vs energy in ice
The zenith angle dependence
Black: cos(zenith angle) < 0.2
Blue: 0.2 < cos(zenith angle) < 0.4
Red: 0.4 < cos(zenith angle) < 0.6
Magenda: 0.6 < cos(zenith angle)< 0.8
Water: 0.8 < cos(zenith angle) < 1.0
Horizontal particles loose the energy more during the propagation.
|
|
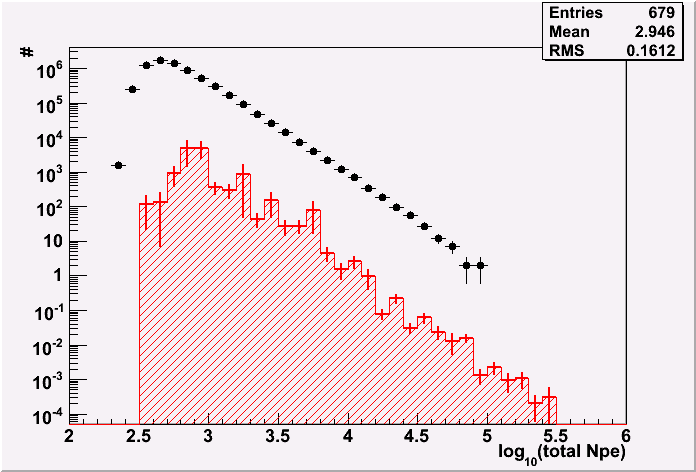
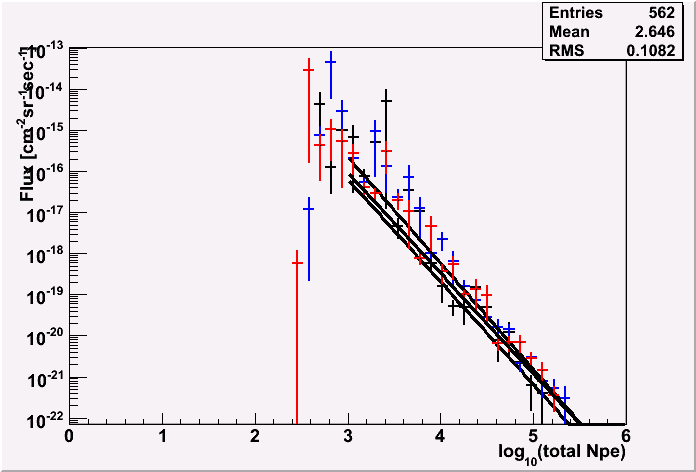
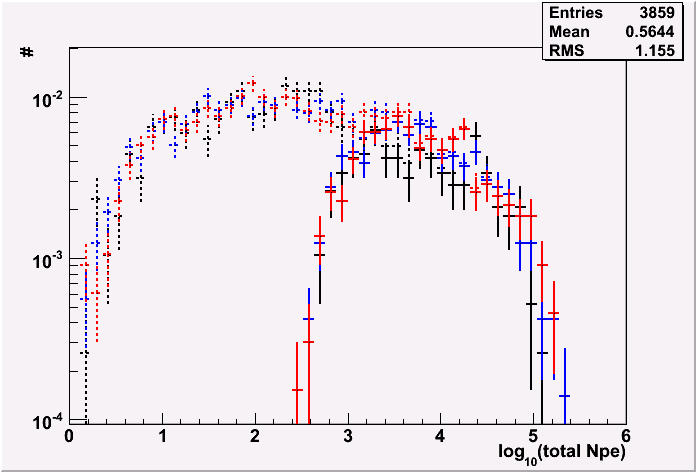
Npe distribution at IceCube detector (in ice) (ECUTS dependence)
Black: ECUTS thres 500 GeV
Blue: ECUTS thres 1 TeV
Red: ECUTS thres 2 TeV
Dot line: without cut
normal line: with DOM#>80
I don't see any difference due to the threshold. This is
probably because the saturation effect of our detector.
|
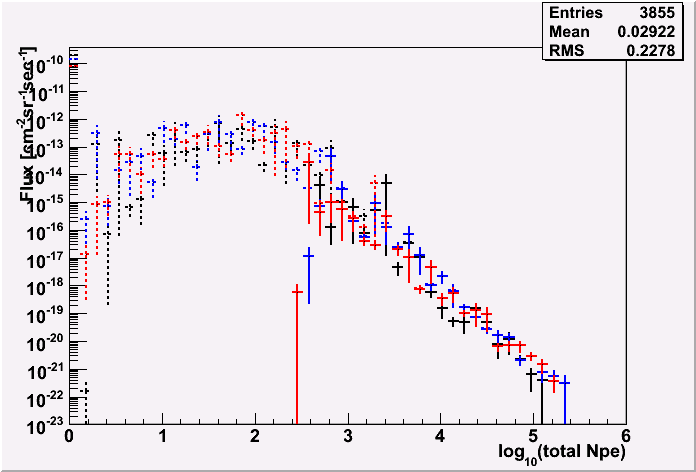
Npe distribution at IceCube detector (in ice) (ECUTS dependence)
Black: ECUTS thres 500 GeV
Blue: ECUTS thres 1 TeV
Red: ECUTS thres 2 TeV
Dot line: without cut
normal line: with DOM#>80
|
|
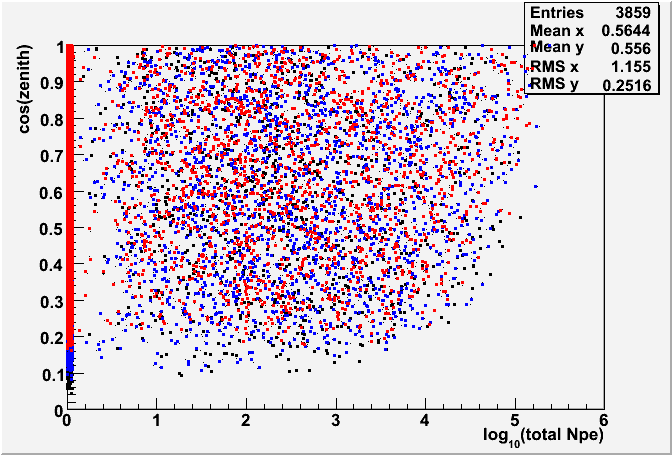
Cos(zenith angle) Vs Npe in ice
|
Cos(zenith angle) Vs Npe in ice
|
|
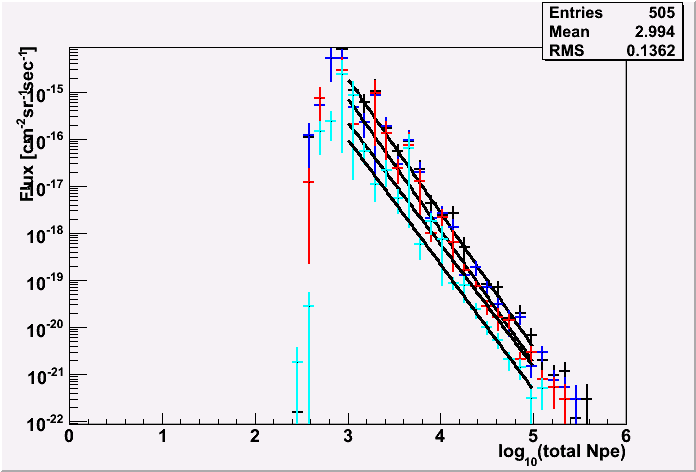
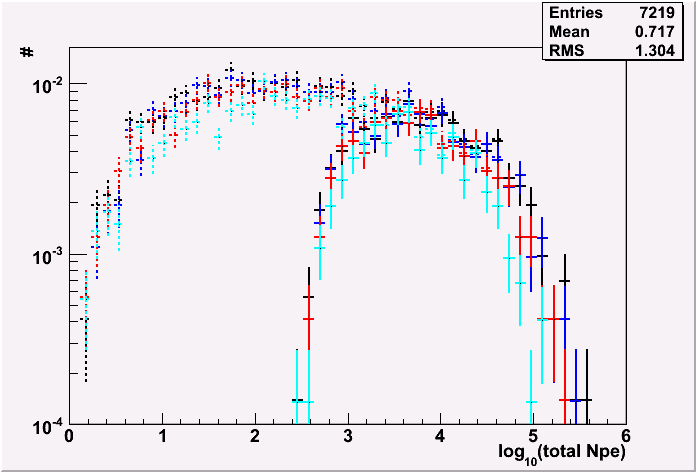
Npe distribution at IceCube detector (in ice) (MinEnergy dependence)
In case of ECUTS 1 TeV. (almost same results in other ECUTS cases.)
Black: MinEnergy thres 50 GeV
Blue: MinEnergy thres 100 GeV
Red: MinEnergy thres 300 GeV
Water: MinEnergy thres 1 TeV
Dot line: without cut
normal line: with DOM#>80
Even though the statistics may not be enough, I would say
MinEnergy of 100 GeV is fine.
|
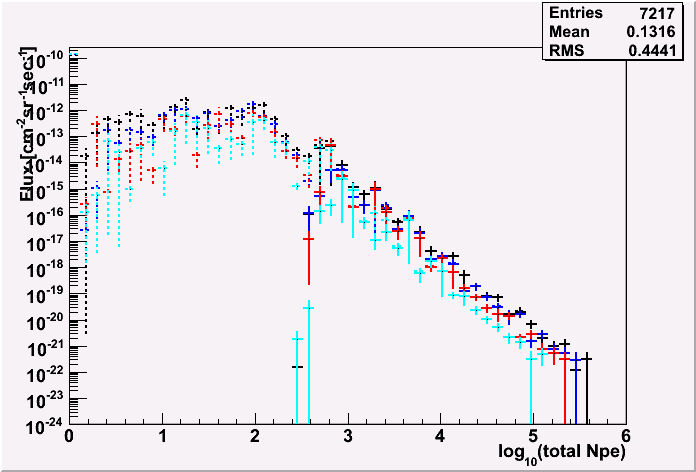
Npe distribution at IceCube detector (in ice) (MinEnergy dependence)
In case of ECUTS 1 TeV. (almost same results in other ECUTS cases.)
Black: MinEnergy thres 50 GeV
Blue: MinEnergy thres 100 GeV
Red: MinEnergy thres 300 GeV
Water: MinEnergy thres 1 TeV
Dot line: without cut
normal line: with DOM#>80
|
|
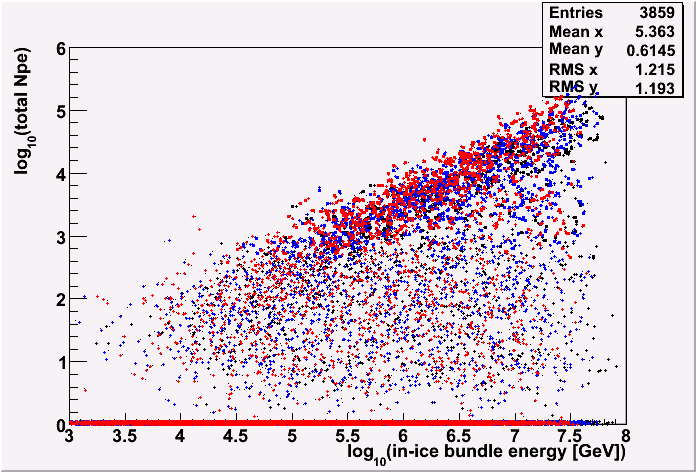
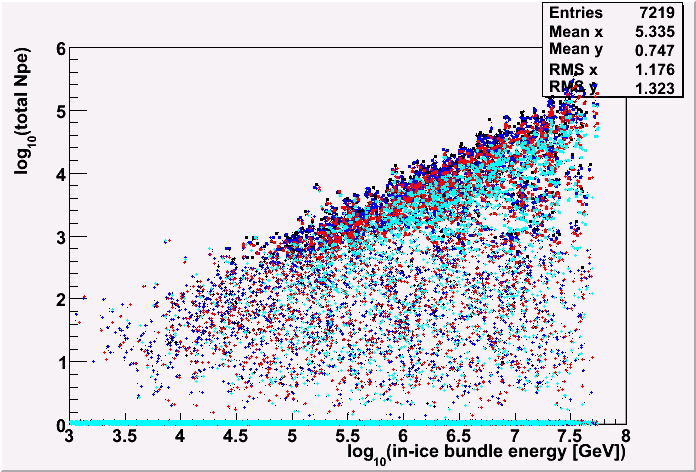
Npe in ice Vs primary energy (MinEnergy dependence)
small points: without cut
bigger points: with DOM#>80
You may be convinced more that the MinEnergy of 100 GeV
(blue dots) is fine to use.
|
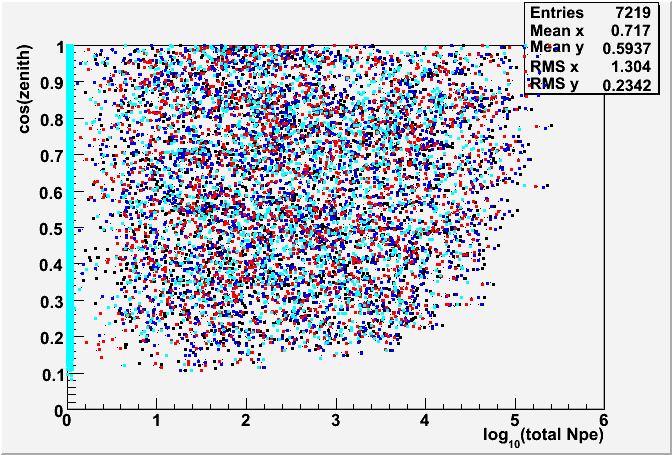
Cos(zenith angle) Vs Npe in ice
|
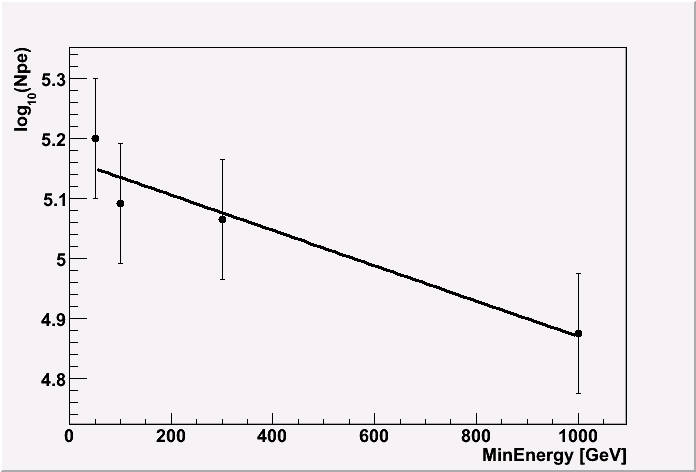
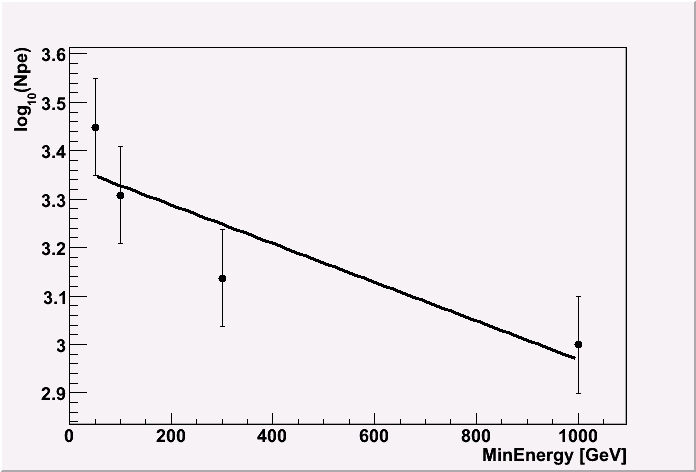
I found the ECUTS of 1 TeV and MinEnergy of 100 GeV reasonable.
The systematic error by using these condition is estimated as ~15%.
