We generated "high energy" corsika samples which starts from 106 GeV because the "standard" corsika files doesn't extend up to EHE region and it adopts the polygonate model which doesn't express the CR flux above ~108 GeV. Here, we have listed up the difference between the "standard" and "high energy" corsika samples, and check those consistency.
The differences between the standard and high energy corsika samples are summarized such as below.
| "standard" corsika | "high energy" corsika | |
| energy range | 600-1011 GeV | 106-10 GeV |
| simulation radius | 800m | 880m |
| energy spectrum | polygonate (weighted dslope=-1) |
simple power law dN/dE = E-1 pure proton and iron CR flux is weighted later* |
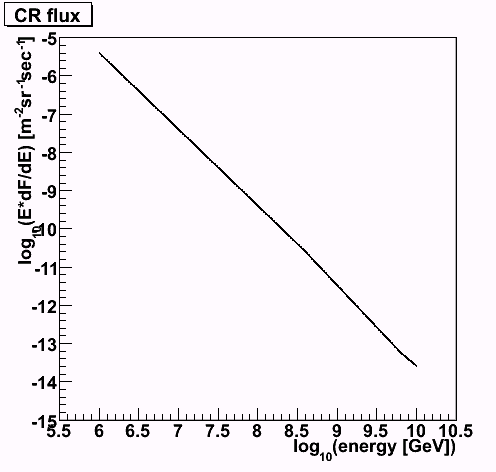
* We weighted CR flux later for the high energy corsika samples. The CR flux is taken from a paper written by Nagano and Watoson. The flux we use is shown below. It's of course consistent with measured CR flux.
|
|
|
Comparison between the weight in high energy corsika sample and measured CR spectrum. The flux in high energy corsika is a bit high at 106 GeV, but within the error of the measurements. 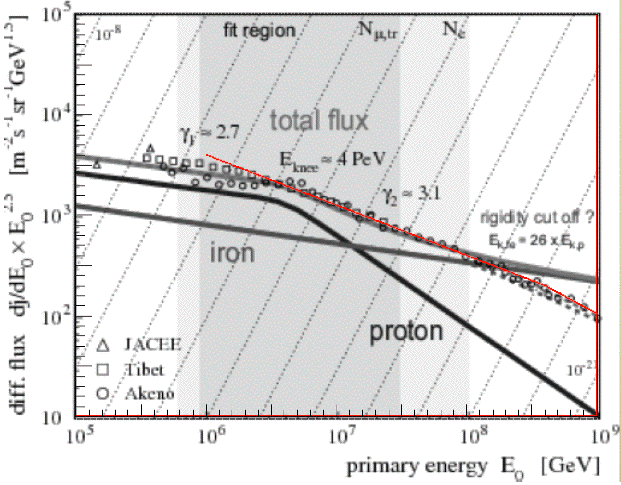
|
Comparison between the weight in high energy corsika sample and the polygonate model. The polygonate model doesn't express the measured CR flux above ~108 GeV. 
|
|
Total Npe (best portia) Vs CR primary energy 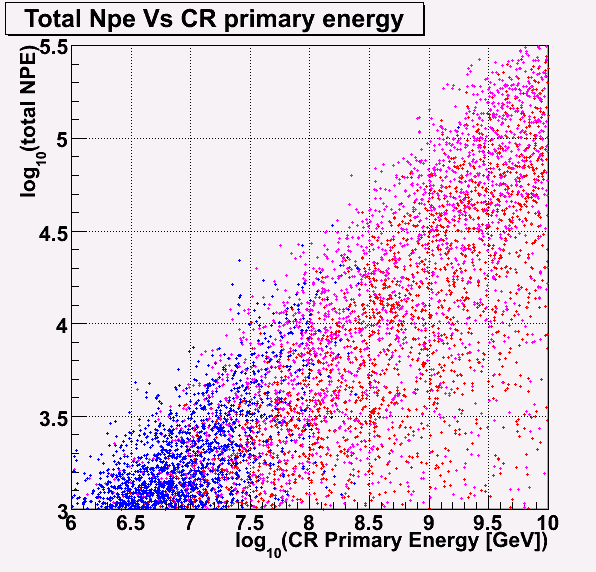
|
Total Npe (best portia) Vs CR primary energy 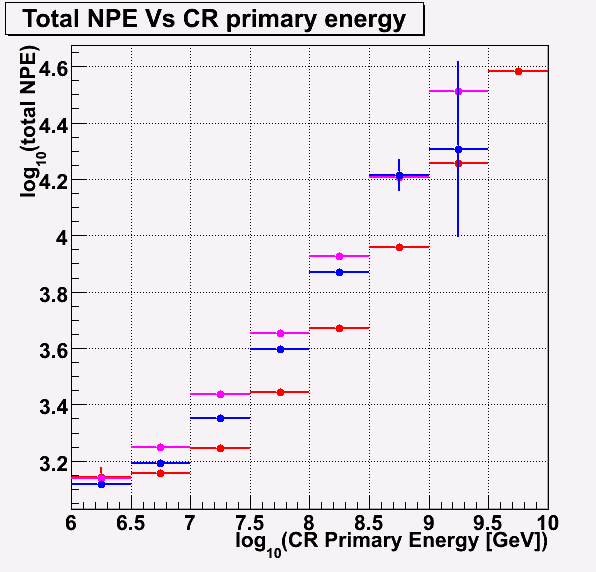
|
|
|
CR primary energy distribution 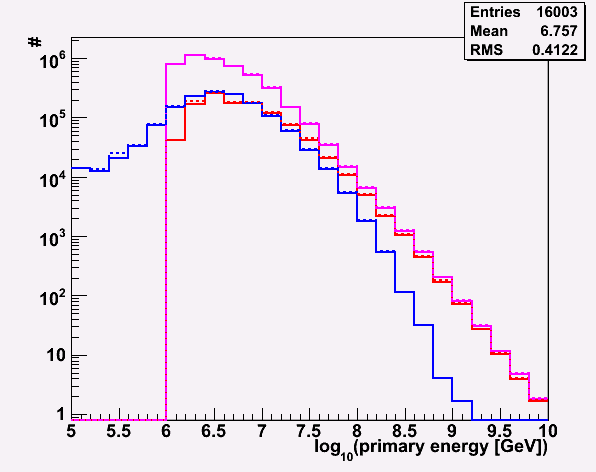
|
NDOM distribution 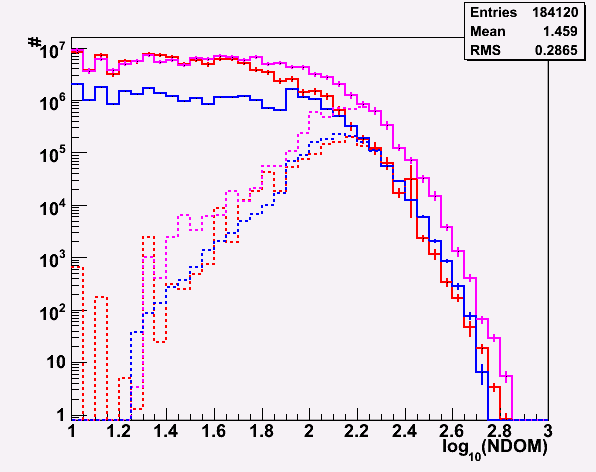
|
total NPE distribution 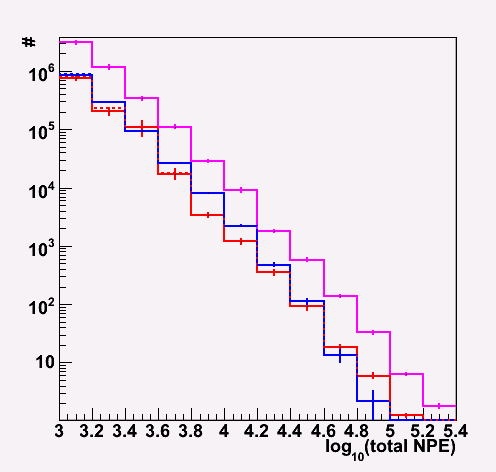
|
|
NDOM Vs CR primary energy 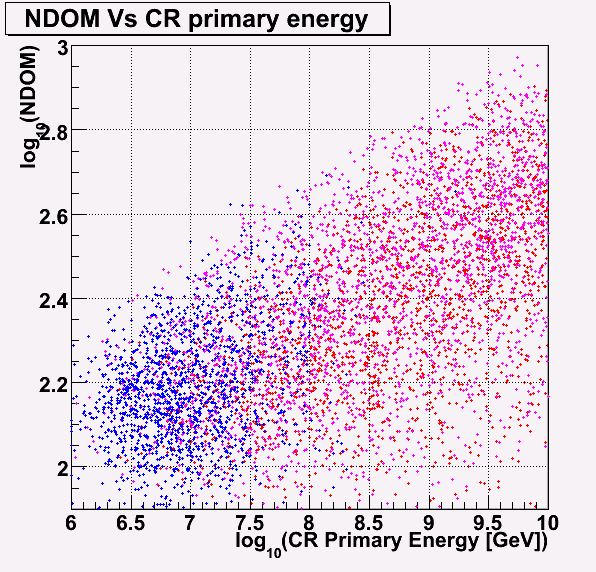
|
NDOM Vs CR primary energy 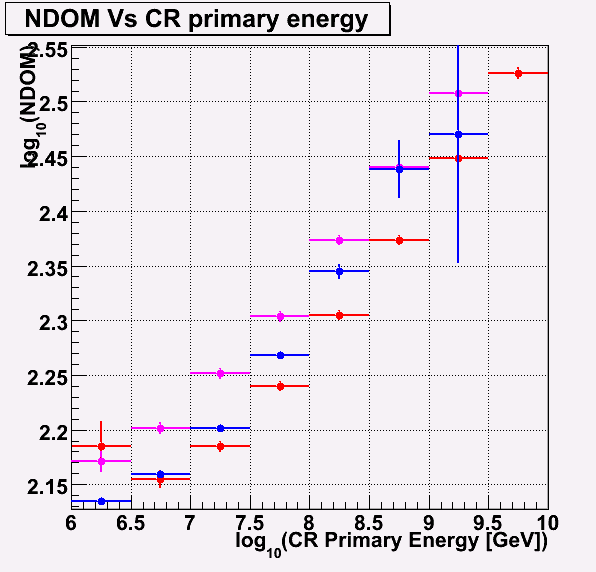
|
|
|
Zenith angle distribution 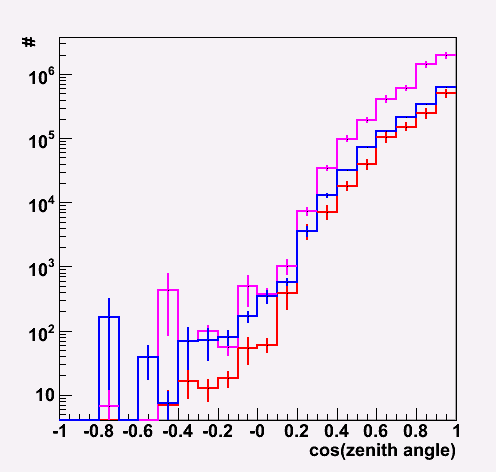
|
||
|
CoGX distribution 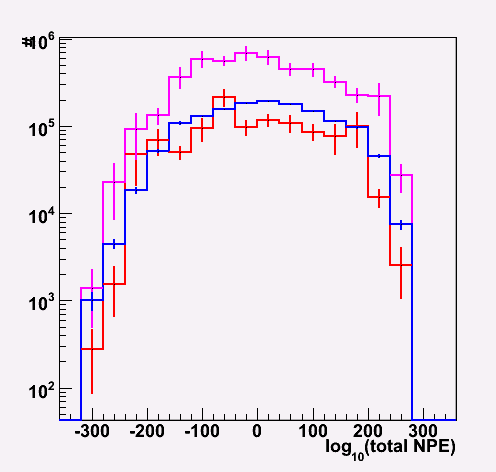
|
CoGY distribution 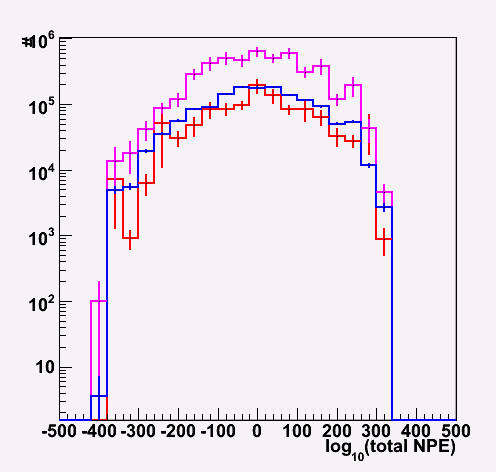
|
CoGZ distribution 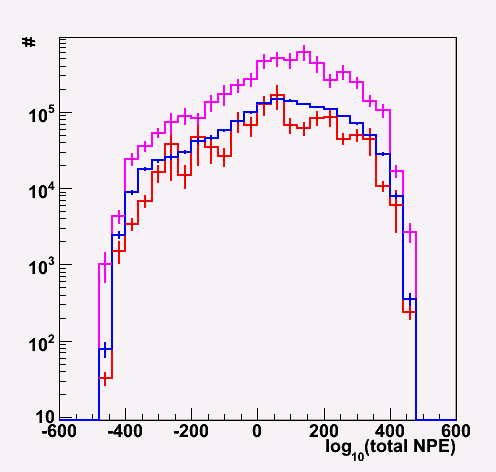
|
Keiichi Mase Last modified: 2008-11-29 03:11:34