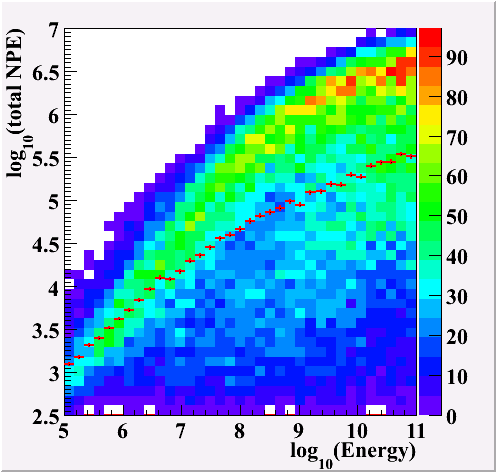
The current default binning width (10 ns)
The statistics is ~50k.

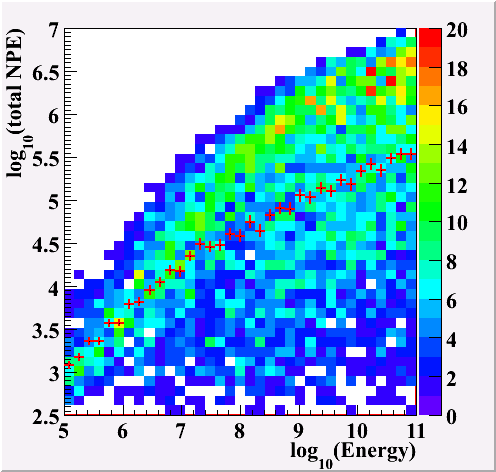
binning width 5 ns
The statistics is 10k.
The distribution is quite similar to 10 ns binning.

The saturation effect of PMT is one of the important thing to be handled well in simulation especially for EHE analysis. It can bias our results.
Kotoyo and Alex have studied the effect. You can see their results from below links.
* Kotoyo's page * Alex's page 1 2
The PMT saturation occures when there are many input photo-electrons. Those photo-electrons are multiplied by getting energy by applied high voltage. Although, the effective voltage between dynodes decreases when there are many multiplied electrons between dynodes. Therefore, the saturation effect depends on the input current.
We binned input photon timing by 10 ns to speed up simulation processing time. This is done in brutus (EHE hit-constructor). Although Kotoyo and Alex have checked that 10 ns binning will be probably fine for EHE analysis by using MC test beams, I just wanted to check the effect by using the full MC data where an EHE muon and full detector response is simulated.
As I said, the current default binning for input photons in brutus (EHE hit-constructor) is 10 ns. I have just changed the value to 5 ns, and change a parameter of RomeoOutputTimeResolution to 5ns, too. The script I used is here.
|
The current default binning width (10 ns) The statistics is ~50k. 
|
binning width 5 ns The statistics is 10k. The distribution is quite similar to 10 ns binning. 
|
I have just checked the processing time with fixed geometry (horizontal) and energy (10^8 GeV) for the relatively fair comparison. (Note that the random seed for interactions changes with time, so the events are not identical.)
I didn't try so many events because I just did like to know the rough number. The event statistics is just 20 events.
The results are the follwings.
Though the statistics is not enough, the 5ns binning seems to be still torelable.
Keiichi Mase Last modified: Wed May 28 01:13:07 JST 2008