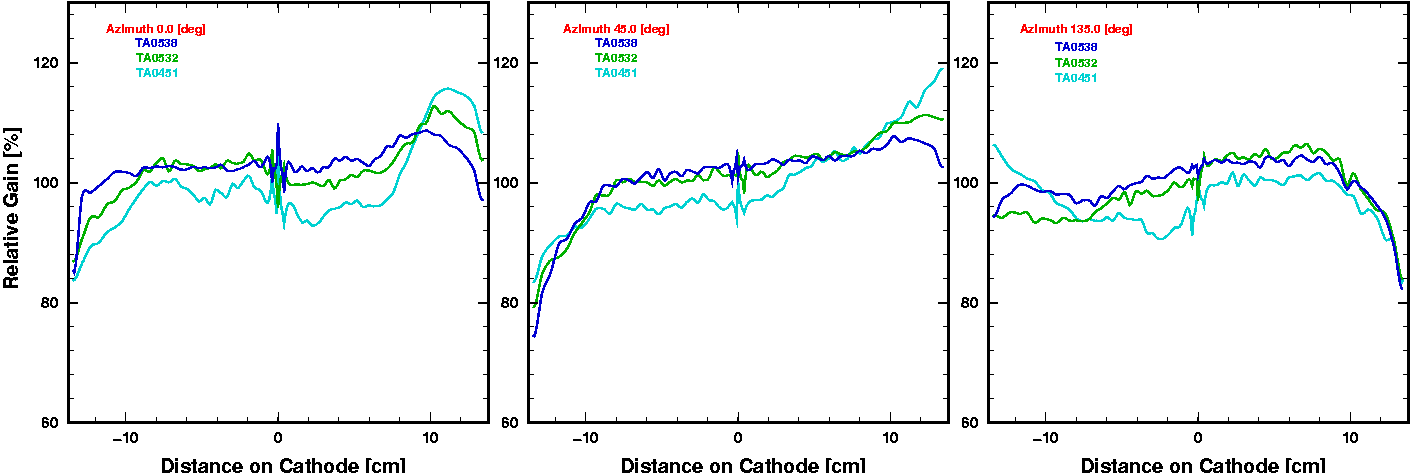


This plot shows the gain variance along the three slices with different rotation angles on the photo-cathode. Data of the three different tubes is plotted. The vertical axis represents the relative gain normalized as 100% in the overall average. The actual (absolute) gain in this data taking is approximately 4.4E7 (at room temperature). The spikes in the center is caused by an interpolation of the data points and you should neglect it.
Although there are slight pmt-by-pmt variances, but the trend is quite same, in contrast to the case of the collection efficiency.
![]()
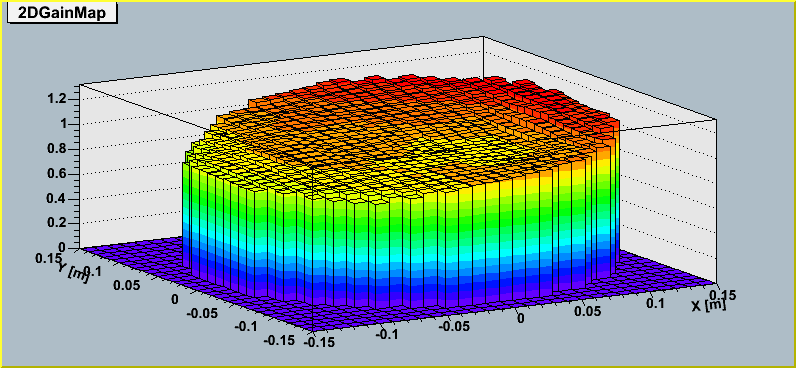
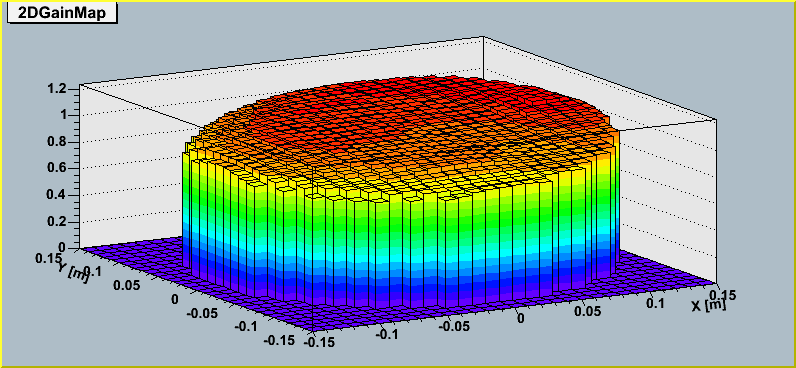
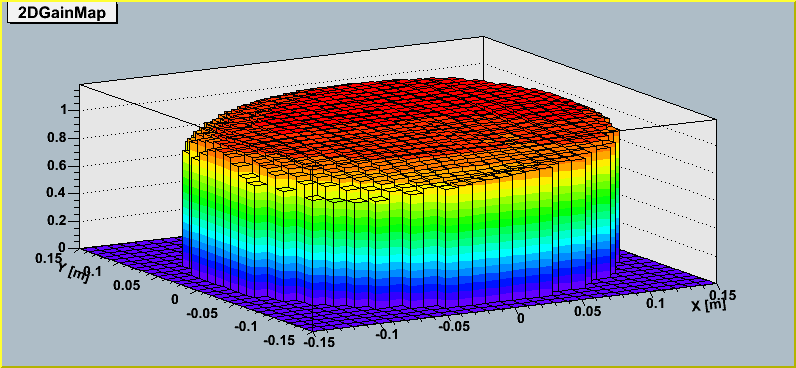
Three figures below are lego plots of the gain map for three different tubes. You can see they share the same general behavior.

|

|

|
It indicates that we need to take into account this gain map, but having a typical tube response represent all the others would probably be good enough.
![]()
mailto:miya@hepburn.s.chiba-u.ac.jp