Last update March 13. 2008

The Summary of Error Estimation due to the Detector


The systematic errors of the absolute calibration and the 2D uniformity measurement of the DOM are summarized. The DOM by DOM difference in the 2D QExCE map is also estimated. The measurement of DOMs verify the detector simulation (ROMEO) outputs. To estimate how the simulation and the measurement agree with each other, the difference between the DOM efficiency which is simulated by the ROMEO and the DOM measurement is calculated. The short review of the measurement and the estimation of the errors are shown below.


First of all, the estimated errors are summarized in the table.

The Errors due to the Measurement of the DOM Error[%]
(1-a) Systematic Error of the Absolute Calibration ±7.8%
(1-b) Systematic Error of the Uniformity Measurement ±5%
(1-c) DOM by DOM difference in the measurement ±10%


The Errors due to the Detector Simulation of ROMEO Error[%]
(2-a) The difference of the NPE estimation between the ROMEO and the data +14.3%*
(2-b) DOM by DOM difference in the ROMEO (PMT cheracteristics) ±4.1%
*Difference = (NPE_simulation - NPE_data) / NPE_data


(2-b) represents PMT by PMT difference in the QExCE map.
As you see, 10 % from (1-c) which includes all systematic errors due to the measurement is equal to the total error from (1-a),(1-b) and (2-b).
In conclusion, the error due to the detector is estimated 10%+14.3% in total.
We guess the main reason of disagreement seen in (2-a) is the incomplete Geant4 simulation in Gel and Glass.
In the future, the number can be reduced with the improved simulation.


(1-a) Absolute calibration of the DOM

Four wavelength LEDs are used as a light source. λ = 365 nm, 470 nm, 520 nm, 572 nm.
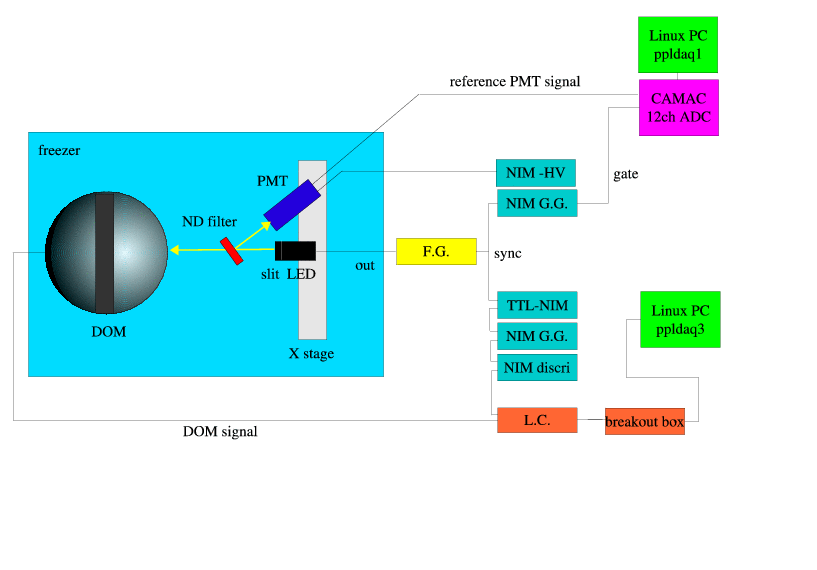
It is dumped by a ND filter. The ND filter reflects the light for a reference PMT and transmit for the DOM which we measure.
Because the reflectivity and transmission of the ND filter are calibrated in advance,
the number of photons coming to the DOM is estimated by the reference PMT.

A connection diagram of the absolute calibration system is shown.


Details of this measurement is stated in the below pages.
They contain the principle of the measurement, how to calibrate the system and the estimation of the systematic error of the measurement.

  • The Principle of the Measurement
  • The Calibration of the ND filter
  • The Estimation of the Systematic error of the Absolute Calibration


  • (1-b)2D uniformity measurement


    (1-c)The variation of the measurement

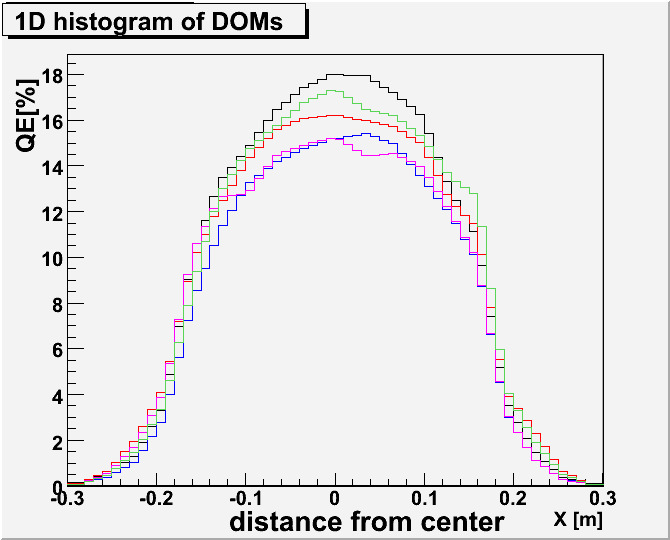
    The variation of the measurement is estimated by the two dimmensional QExCE map of 7DOMs.
    Below figure shows the QExCE as a function of the distance from the center for each DOMs.
    Different color means differencet DOMs.


    The standard deviation of the absolute efficiency is estimated over the DOM surface for 7 DOMs of FY2006.
    It is estimated 10%. (by.Yuusuke.Hasegawa)
    See also Average 2D scan page

    (2-a)The difference between the ROMEO and the data

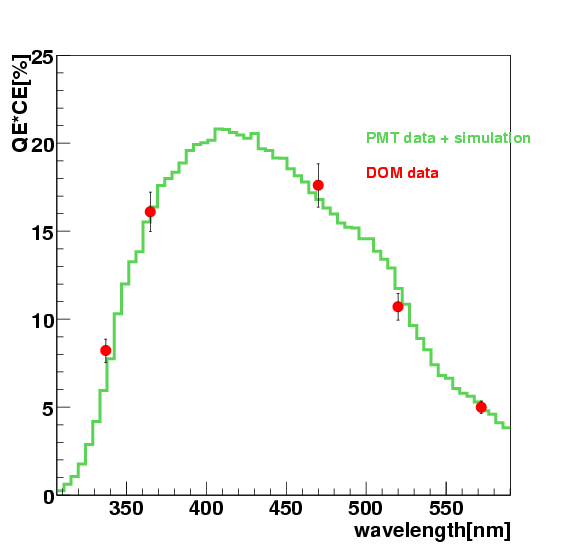
    The QE at the center is shown as a function of the wavelength in the below figure.


    Red color is the measurement of the DOM, green color is the simulation and blue.

    For the estimation of the difference between the data and the simulation,
    the absolute efficiency of the DOM are estimated for the same position over the surface.
    The DOM surface is divided into 32 axis and one axis is divided into 34 points at 1 cm interval along the surface.

    The figure (Fig) shows the QExCE as a function of the distance from the center of the DOM.
    Blue is the data measured in lab and red is the simulation predicted by ROMEO.
    This is the case of 365 nm.
    The absolute efficiency at 545 points are used for the comparison.

    The number of photo-electrons are calculated for each points.
    The points are radially, so the point at the edge covers larger area than the one at the center.
    For a compensation, the surface area is considered as a weight.
    The difference between the simulation and the data are summarized for each wavelength in the table below.
    The average PMT data is used in the ROMEO.(cf.Data summary)
    The relative difference of NPE between the simulation and the data is described as 'Difference' in the table.

    Difference = (NPE_simulation - NPE_data) / NPE_data

    Lambda Difference[%] Azimuth[0~168deg] Azimuth[180~348deg]
    337 nm -7.6% Fig Fig
    365 nm 14.5% Fig Fig
    470 nm 11.2% Fig Fig
    520 nm 33.8% Fig Fig
    572 nm 17.6% Fig Fig


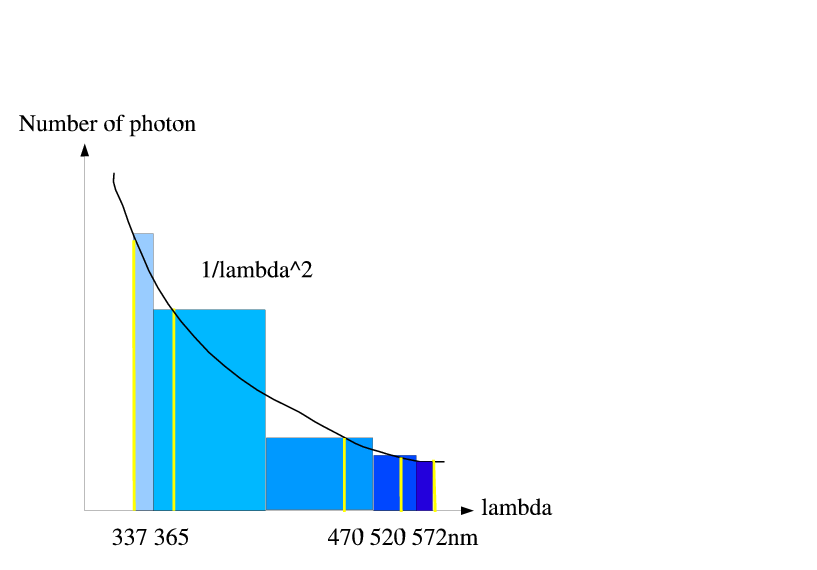
    The incoming photons with energies following the primary Cherenkov emission spectrum 1/lambda^2 is supposed.
    Because the comparison can be made only for the wavelength at which the calibration data is available, we summed 5 wavelengths as shown below.
    The total difference of the NPE is estimated as 14.3%.
    This means that our current simulation overestimates photons 14.3%.


    We guess the main reason of the disagreement is the incomplete Geant4 simulation in Gel and Glass.
    Below figure shows the 2D map of DOM by the simulation, the measurement, and the subtraction, from left to right.(@ 470nm )


    We have seen that simulation leads to more uniform 2D response than the calibration measurement suggested, especially at the edge.
    Although the efficiency is low at the edge, the covered area is large. It is unignorable.
    In the future, we will improve the detector simulation to reduce the disagreement.


    (2-b)DOM by DOM difference in the ROMEO (PMT characteristics)


    The averaged data of the PMT measurement is used as an input for the simulation.
    How the simulation varies DOM by DOM is shown here.
    For 7 DOMs of FY2006, Npe is estimated with the same method shown above.(cf.Data summary)
    As a result, the DOM by DOM difference of the Npe is 4.1% in the ROMEO.
    This number is approximately consistent with the variation of the input data, which means the characteristics of the PMTs.