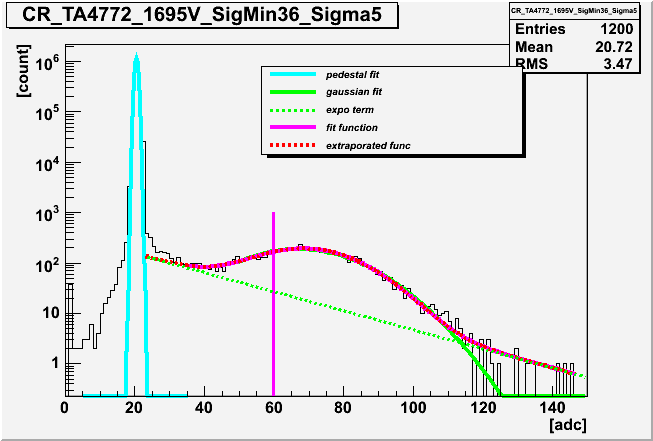

gain dependence

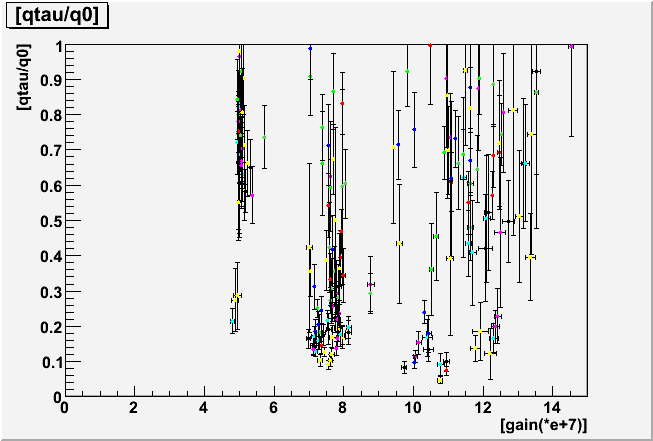
As reported in the previous
Charge response page, the main parameters to be fit with the SPE charge histogram
to represent the SPE response of the IceCube PMT are :
We have found that the range of the ADC counts (equivalent to charge) in the histogram for fitting the function may have a possibility to include multi photoelectron signals. The newly defined narrower range in the fitting clearly excluding the (possibly) two photoelectron contributions gives shorter decay time of the exponential term. The present analysis described here, therefore, concluded PMT response with more frequent outputs of photoelectron less than 0.3. However, this change gives only very minor effects in the actual IceCube simulation because the detection efficiency for photons greater than 0.2-0.3 photoelectrons is mostly involved in the simulation data and because the photoncs table and the Romeo simulation has been adjusted so that they give correct probability of photon detection for NPE larger than 0.2-0.3 which was directly measured in the Chiba's absolute calibration. In other words, the resultant absolute efficiency in this NPE region is almost unchanged between the present and previous response function. Updating of the photonics table and the Romeo/pmt-simulator is, thus, not urgently important. It is probably a good idea to do so after the IC-22 MC data mass production.
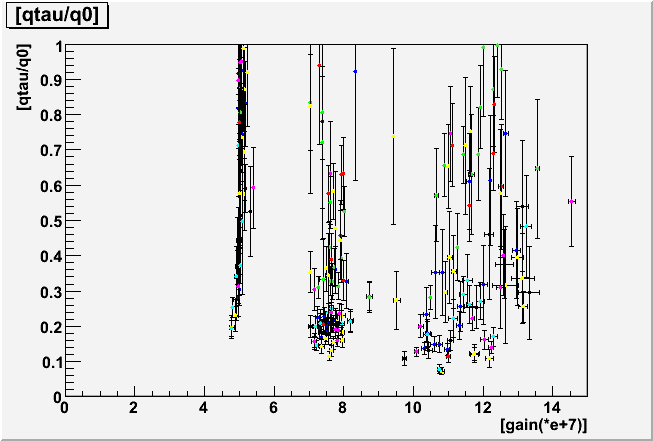
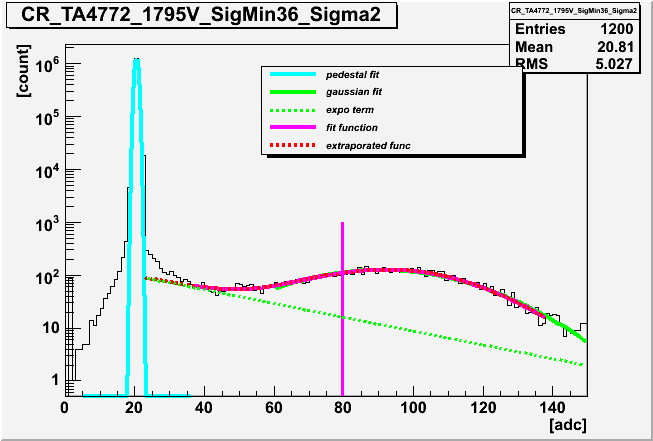
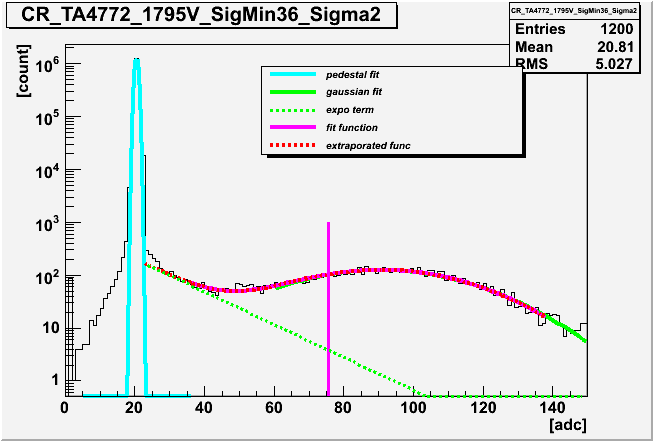
The fitting range in the previous analysis contained all the ADC counts below the 5 sigma beyond the SPE peak. The high ADC events possibly generated by two photoelectrons made a major contribution to determine the slope of the exponential term as shown below. The new analysis uses events with NPEs smaller than the SPE peak + two sigma instead. It then indicated shorter decay time in the exponential term. However, the range in the exponential shoulder is too narrow to allow stable fitting. The qtau/q0 values derived in the fitting now appears to vary a lot from PMT to PMT, from one gain to another.
The two photoelectorons effect analysis is here
| The previous analysis (including 5 sigma from peak) | The present (SPE + 2 sigma) | |
| Fitting Histogram |
 |
 |
| qtau/q0 gain dependence |
 |
 |
The above plots indicated that we can no longer determine the qtau/q0 in reliable manner. In many cases, however, the qtau/q0 is obtained around 0.2 as seen in the lot below.
| Gain Dependence of qtau/q0 | Correlation of qtau/q0 and P_ex |
 |
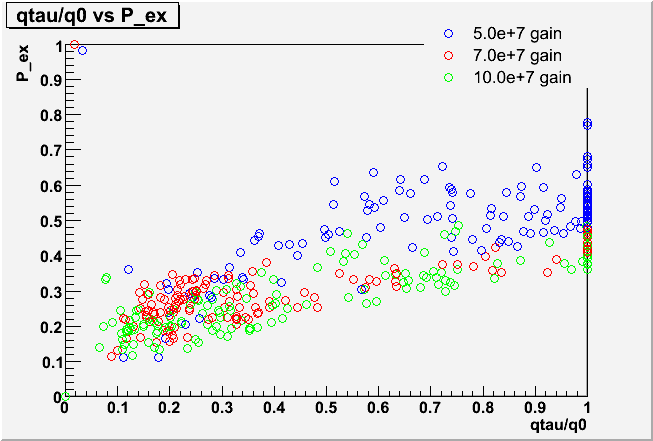 |
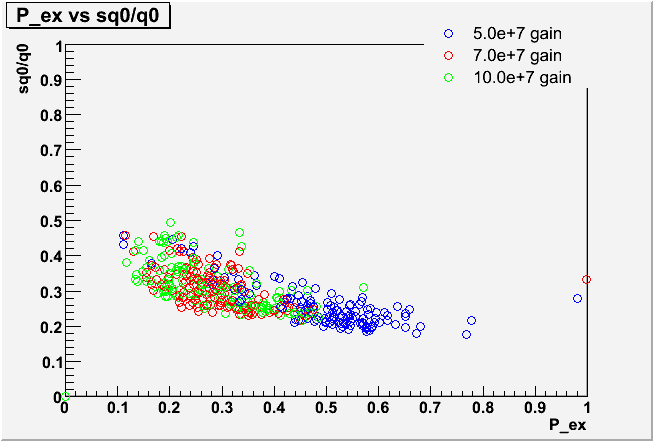
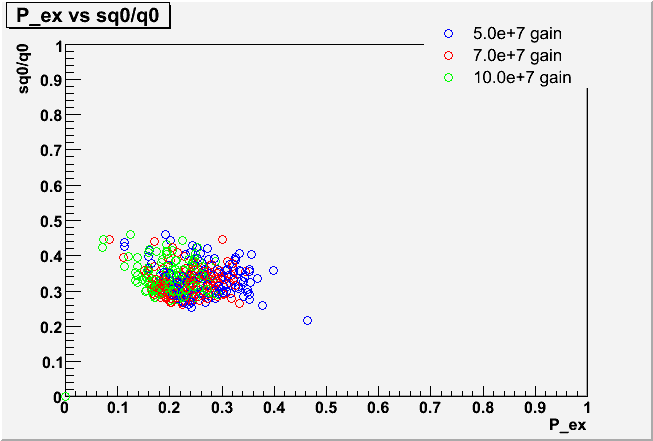
Although the fit values for qtau/q0 vary by a lot from PMT to PMT, the individual ADC spectra do not look very different from PMT to PMT in the fit region (which starts at 0.2 p.e in order to stay away from the pedestal noise). Apparently the three parameters qtau/q0, sq0/q0 and P_ex show some degeneracy for describing the low ADC region. This can be seen in scatterplots of the fit results, where the large differences seen in qtau/q0 are strongly correlated with smaller differences in the other parameters.
| not fix qtau/q0 | fix qtau/q0 = 0.2 | |
| Correlation plots of sq0/q0 and P_ex |
 |
 |
| Fitting Histogram |
 |
 |
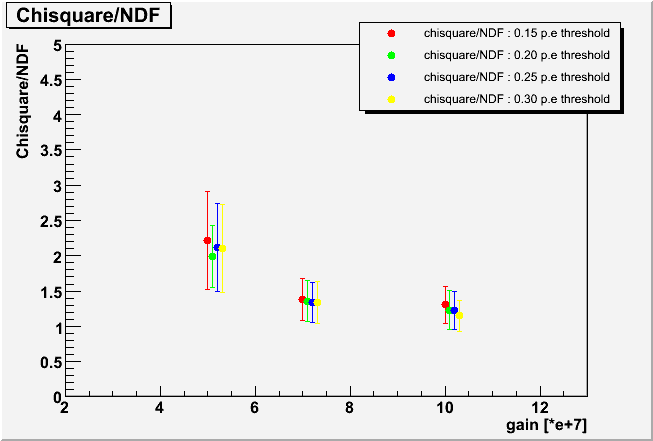
| Chisquare |
 |
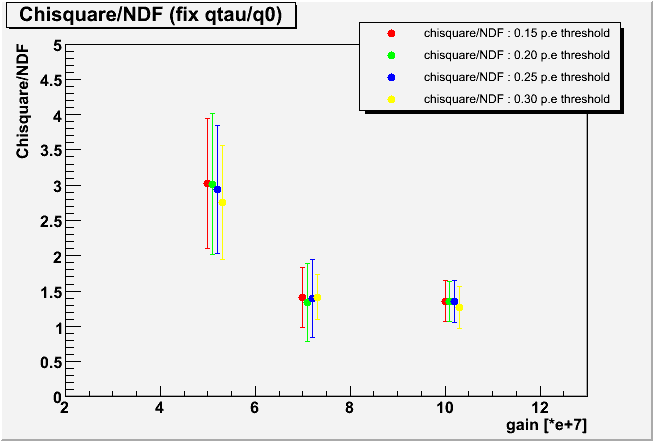 |
The resultant chi square distribution also indicated that the fitting in this new method works good. Let us remark that the lower limit of the ADC counts in the fitting (0.2 p.e equivalent) was carefully determined by examining the pedestal data taken without LED flashing. The slope of the exponential term is indeed determined from real PMT pulses - NOT from tail of the pedestal distribution.
| Gain Dependence of Mean | charge response function |
 |
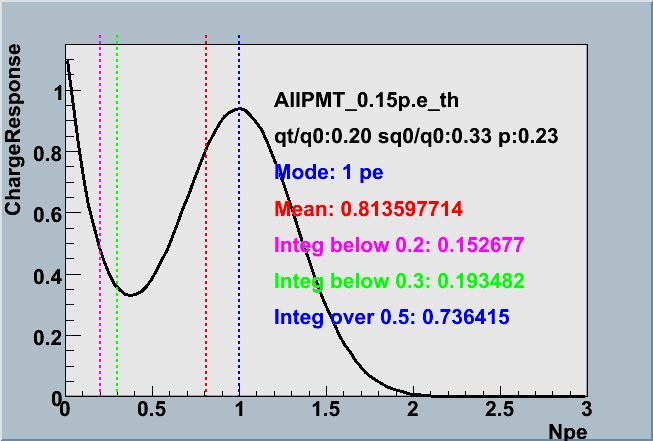 |
The "Mean" of the function (red dotted line in above right figure) essentially determines the average charge in unit of photoelectrons - this would have been unity without the exponential term. The fact that it is below unity implies that our PMT outputs less than *one* photoelectron charge defined by the SPE peak in average. This effect apparently gives lower photon detection efficiency, but it is less expected to have the strong gain dependence. The plot above indeed confirmed it. The analysis indicated that the mean is increased with the PMT gain only in very weak manner.
One might think that fluctuation of this value, and thus the photon detection efficiency, is very sizable from PMT to PMT. This is not true because this apparent fluctuation arises from the exponential term that determines the relative probability of PMT outputting very small charge. The probability of PMT generating more than a quarter of photoelectron rather plays an important role in the IceCube measurement. Its absolute value and its PMT-to-PMT variance have been measured in the absolute calibration which both the present photonics table and the romeo have included at least in the average basis. We describe more about this issue far below in this document.
| sq0/q0 | P_ex | |
| 0.2 p.e threshold | 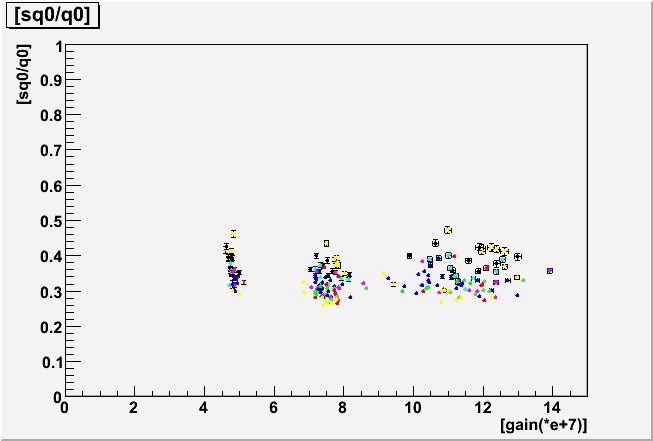 |
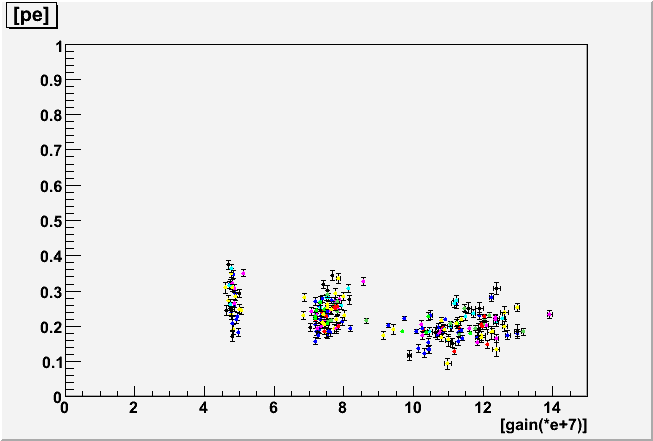 |
The two parameters, sq0, qtau have been again confirmed to be scaled with the PMT gain in the present analysis, which justifies the use of this function inside the detector simulation in the gain independent way. The parameter pe exhibits a weak gain dependence, but not much.
The comparison of the PMT-average charge response function between the new and the previous function is shown below. It also shows the functions determined by different threshold of photoelectrons in the fitting to see its robustness. It is found that the function is reasonably stable and unchanged no matter the lower value NPE in the fitting you set. Each parameters also averaged over all range gain of this analysis.
The absolute PMT calibration analysis ( an example ) estimates the hypothetical PMT efficiency of photon "detection" defined by outputting pulse larger than *zero* photoelectron by using the charge response function. You can not directly measure this value because you are unable to tell each of tiny pulses is a real PMT output or just a noise. The estimation of the detection efficiency has been made by using the relative probability of PMT outputting pulses smaller than 0.5 photoelectron which can be obtained by the ratio of the charge response function area as illustrated below.
| Area(>0.5 p.e) | Area(>0 p.e) |
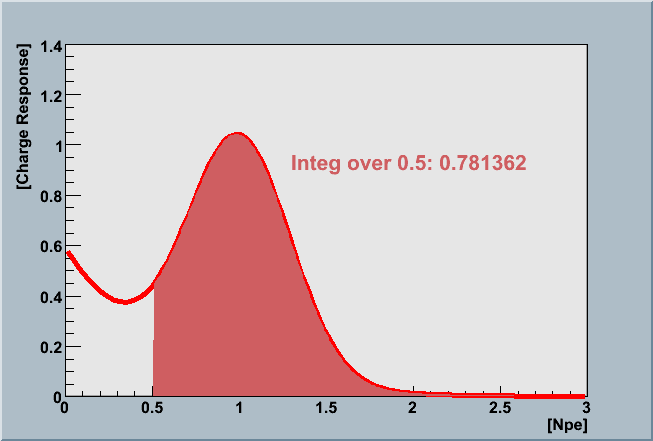 |
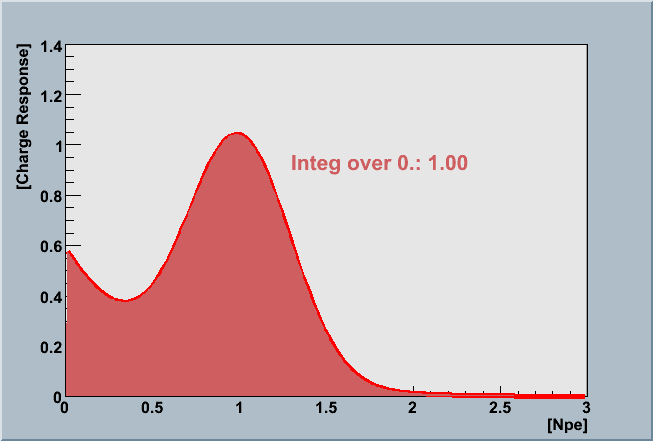 |
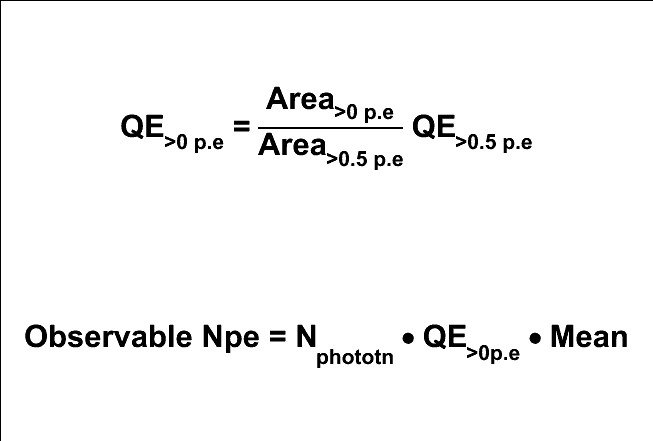
This ratio is multiplied by the measured QE value obtained by the Chiba calibration using the 0.5 pe threshold to discriminate the signal. Then you see :
 |
The value "QE>0p.e" above is used in the photonics table.
Then the pmt simulator generates pulses following the charge
response function. The DOM simulator discriminates it with 0.2-0.3 p.e
threshold. Therefore, our MC data relies on the PMT/DOM *detection*
efficiency with 0.2-0.3 p.e. threshold. In other words,
the new charge response function described here which gives more pronounced
possibility of generating NPE less than 0.3 will lead
to larger number of "QE>0p.e".
Then the effect is canceled out
each other and it ends up with very similar results that depend
mainly on the absolute calibration data actually measured with 0.5 p.e threshold.
The second equation above might be helpful to understand this.
A Npe that is observable by a PMT is roughly follow the equation above
because the effect of the charge response is equivalent to the p.e. reduction
by the "mean" value for many p.e.'s. In case the "mean" value is small,
the QE>0p.e. becomes higher by the first equation, so that the product of QE>0p.e.
and the "mean" cancel out with each other.
In order to verify it, we performed a numerical experiment. We shot (in the computer) 1000 of photons at wavelength of 337 nm to the DOM housing the PMT TA2086 and see generated charge by the Romeo. We put both the previous analysis results and the present to the Romeo internal table and made comparison. Here is the result:
| Mean of the response function | Integral of the function (>0.5pe) | QE(>0pe) | Generated Npe by Romeo | |
| #1 the present analysis | 0.8079 | 0.7317 | 0.2255 | 182.18 |
| #2 the previous analysis | 0.8505 | 0.7814 | 0.2112 | 179.63 |
| Difference #1 / #2 (%) - 100 |
- 5.27 | - 6.79 | + 6.34 | + 1.20 |
The difference in the end is an order of a percent which is much smaller than the systematic uncertainty of the absolute calibration.
The new analysis suggested the PMT charge response with more pronounced exponential term. We will write this result in the IceCube PMT paper. It is found, however, the resultant systematic shift of NPE in the IceCube simulation is tiny. Updating the photonics table and the pmt simulator using this analysis is, therefore, unimportant at least before we complete the IC-22 MC mass production.
Many thanks go to Chris Wendt who first realized the fitting range problem.