
![]()
Contents:
The first thing to do was to know the transmission of ND filters that we used to control photon numbers. Once the ND filters are calibrated, we can know the incident photon number to a PMT and compare the number with the measured photon number.
The detailed setup and the results are the followings.
top
We put a PMT (Serial #: TA1069) in a black box. We use a UV LED (Nichia) to illuminate. We put an optical bench between the PMT and the LED, different ND filteres (SIGMA KOKI) being installed on it. (Sorry for the fix of the bench by tapes, but it was fixed well. We confirm it through mesurements with the same condition.) The ND filters we used is composed of transmission of about 50%, 10%, 5%, 1% and 0.1% at wavelength of 500 nm. Since the peak wavelength of the LED is about 380 nm, we had to know the transmission at the wavelength.
We used a pulse generator to make rectangular pulses with the width of 10 nm.
We put 1200 V of high voltage for the PMT, which corresponds to a gain of ~10^7 for the PMT (This is checked by a single photo-electron peak.).
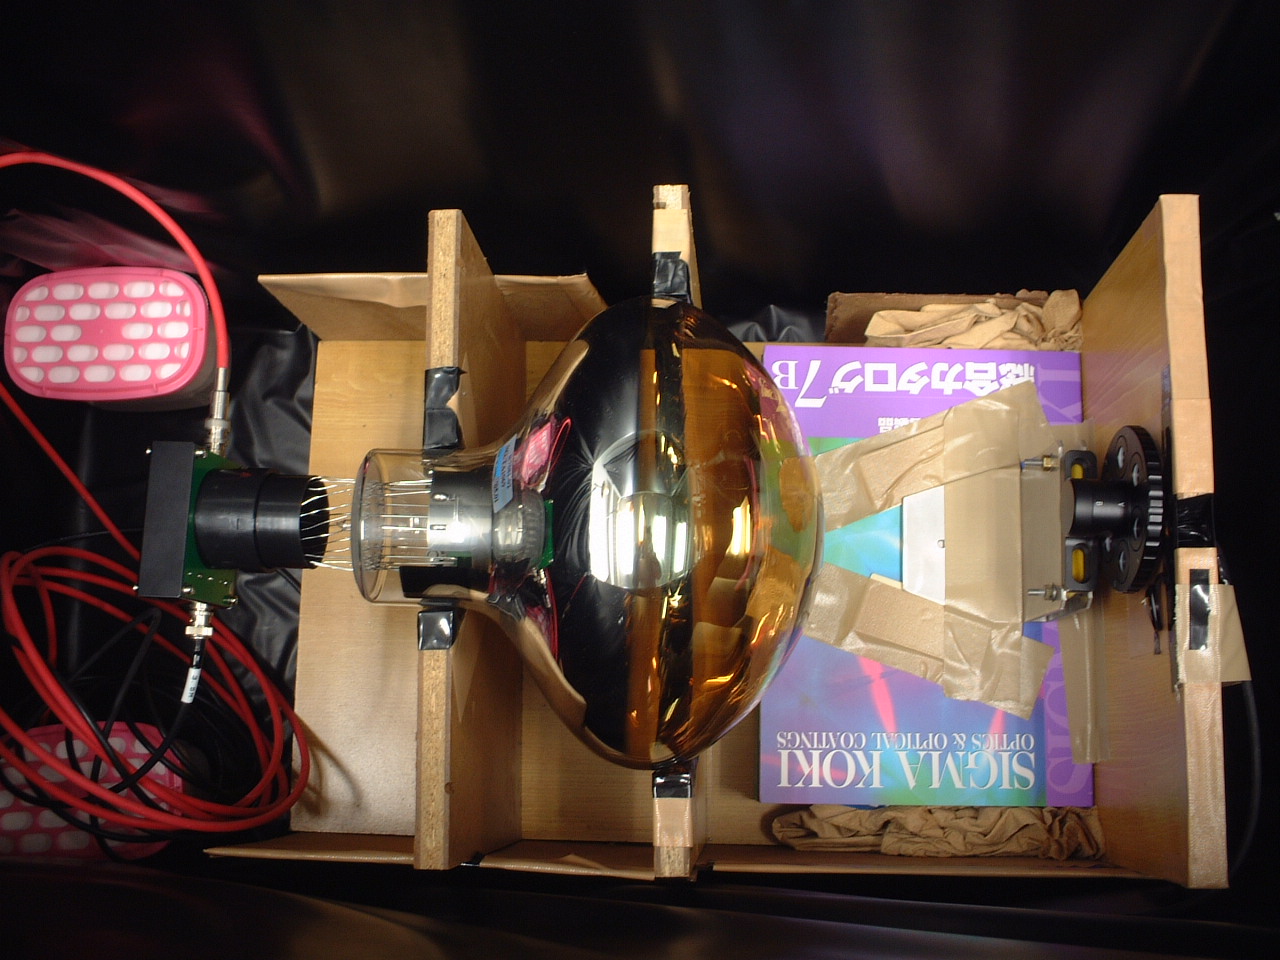
I. Calibration of ND filters
We have calibrated ND filters using CAMAC, converting the analog signal to the digitital counts. The coincidence was required with a pulse generated by a NIM gate-generator with the gate width of 75 nm.
An adequate intensity of the LED is selected to calibrate two filters. We could calibrate only a transmission between two filters at a same time due to the limited dynamic range of the ADC module (LeCroy 2249A, 10 bit). So, we repeat this procedure for each set of two filters.
II. The measurement of the dynamic rangeWe measured the dynamic range using the calibrated ND filters. We change the transmission of the ND filteres, the light intensity of the LED being same.
We use an oscilloscope for its large dynamic range. The data from the oscilloscope was read through GPIB.
top
An example of the result of a filter calibration is shown in the next figure. In this case, the voltage applied to the LED was 1.99 V for between no filter and 50% transmission one. We shot 100,000 pulses for each measurement. We can get the transmission by getting the ratio of the two peak of ADC counts, subtracting the pedestal (The pedestal was 21.6 ADC counts.).
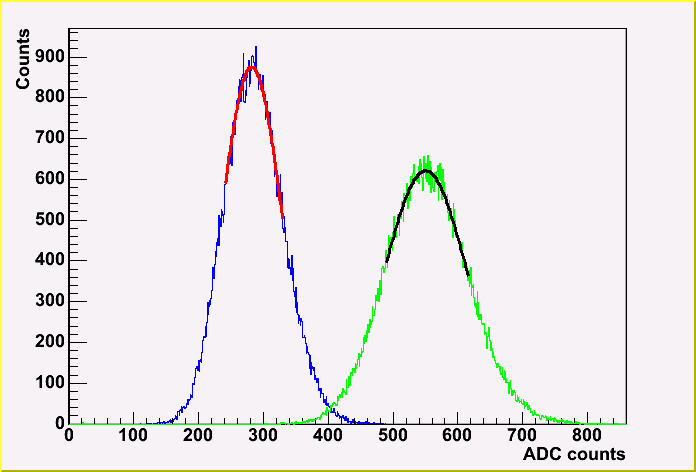
The calibrated transmissions of each ND filter @ 380 nm are summerized as the followings.
| Filter name | Transmission @ 500 nm | Transmission @ 380 nm |
|---|---|---|
| FND-15C02-50 | 50% | 49.4% |
| FND-15C02-10 | 10% | 10.1% |
| FND-15C02-5 | 5% | 5.57% |
| FND-15C02-1 | 1% | 0.641% |
| FND-15C02-0.1 | 0.1% | 0.0926% |
We took 100,000 events for each measurements, so the statistical error should be ignorable. However, there is a systematic error which mainly comes from an unstability of the LED. In order to evaluate the error, we repeat the same measurements, and the systematic error turned out to be about a few percent. Note that a transmission is derived by multiplying the ratio of two peak ADC count by the previously derived transmission. For an example, to get the transmission of 10% filter, we multiply the two ADC peak ratio of 0.216 by the previously derivecd transmission of 49.4%. We started from no filter and 50%, therefore the systematic error will accumulate for the small transmission filter.
II. Dynamic range of the PMTAfter the calibration of ND filteres, the dynamic range of the PMT is examined. The voltage of the LED was fixed to 2.10 V. This intensity is selected to correspond to the intensity of about one photo-electrons (p.e.) (Later soon corrected) with minimum transimission filter (0.1%).
The ADC spectrum is taken with this setup in order to know the number of the incident p.e.
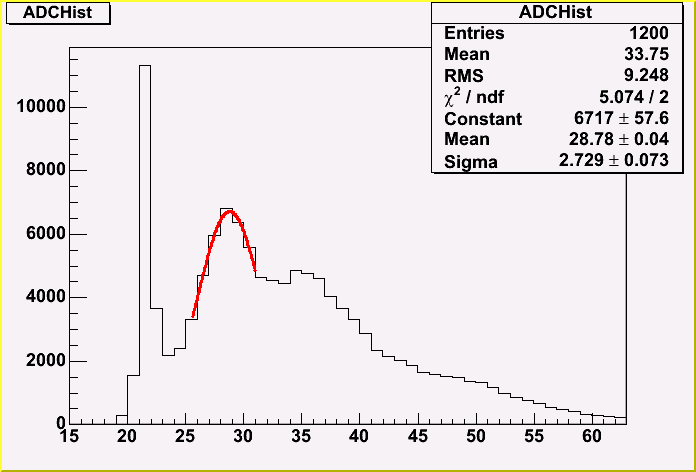
From the plot, 1 p.e. turned out to be 7.16 ADC counts. Since 1 ADC corresponds to 0.25 pC in the used ADC module, the gain is 7.16*0.25 pC / 1.60*10^-19 C = 1.12*10^7. The expected incident p.e. is calculated as (33.75-21.6)/7.16 = 1.69 p.e., assuming a poisson distribution.
Since we have already known the transmission of each ND filter, we can know the incident p.e. when other ND filter is used in this setup. We measured the output for each incident p.e.
In order to extend the range more, the same procedure is repeated to the LED voltage of 2.25 V, which corresponds to roughly 12.5 times more intensity than the case of 2.10 V.
The result is shown in the following plot. The blue and red points correspond to the case of 2.10 and 2.25 V respectively. In either case, the more p.e. number becomes, the more transmission of the filter do, namely 0.1, 1, 5, 10, 50, 100 %.
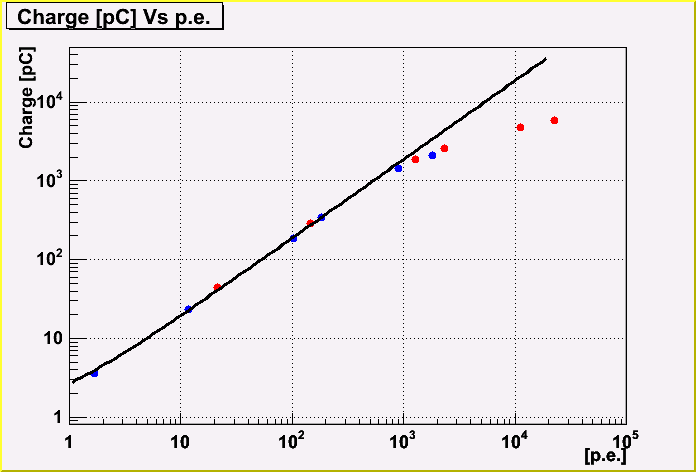
As seen from the plot, the saturation begins around 1,000 p.e.
The fit is done using the data less than 500 p.e. The equation is the followings;
(Charge [pC]) = (0.795+-0.077) + (1.877+-0.003)*(p.e.)
The gain is derived as 1.17*10^7 from the slope.The gain is consistent with the value from ADC spectrum.
The fitted line is not on the origin. This will be due to some background lights.
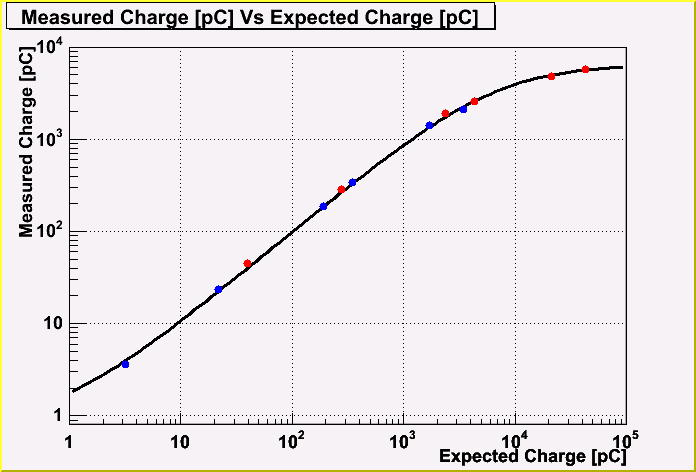
To get the formula which represents the saturatoin, the data points are fitted with the function of 0.795+[0]*x/(1+[1]*x) after the incident p.e. is converted to the expected charge when linearity is assumed. The function is derived as the followings;
(Measured Charge [pC]) = 0.795+(0.998+-0.0005)*(Expected Charge [pC])/ (1+(1.54+-0.001)*E^-4*(Expceted Charge [pC]))
We can put this formula to the Monte-Carlo simulation of ROMEO.
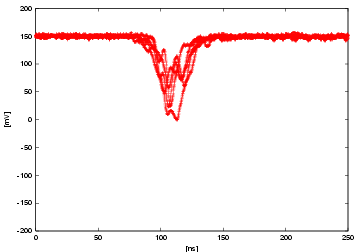
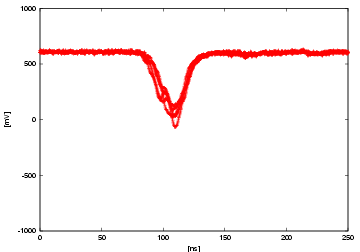
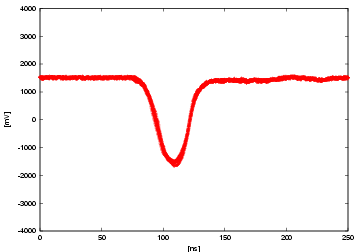
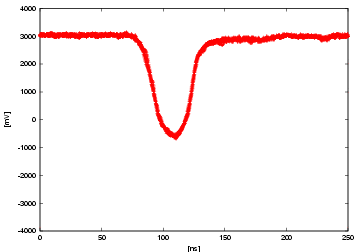
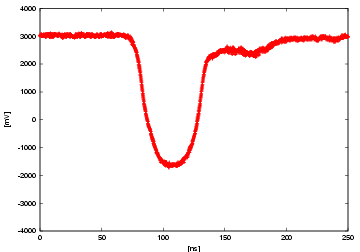
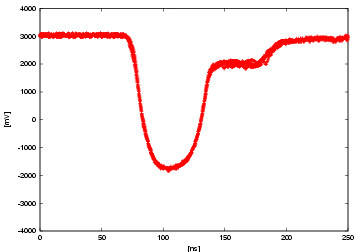
At last, we show the raw waveforms taken by an oscilloscope. 5 events are overlaid in a same plot. Each plot corresponds to a case of a filter with fixed LED voltage of 2.25 V. From the top, the filters are 0.1, 1, 5, 10, 50%, no filter respectively. Each plot also corresponds to the red point in the previous plots. You can clearly see the saturation from the last two plots of the waveform by itself, and the saturation level is more or less same of about 4.8 V. Note that the effect of the after pulse gets bigger as the incident p.e. becomes more. (We integrated the part of the after pulse region, too, for the previous plots.)
 top
top