SC Study
IceCube/EHE Search
/9-string analysis
NPE using this baseline study
This page is continued from
Introduction and ATWD Baseline study
Then, this page is continued from
FADC and Reduced Bin Number Baseline study
Note that new baseline option described in this study is added to the trunk of Portia.
Short summary of this page is here,
ATWD baseline option:
- Take option the first 2 bin average.
- if the value is smaller than -1mV, larger than 2mV, take option zerobase i.e., consider the baseline as 0mV.
- Then calculate NPE using the baseline.
- If the obtained baseline is non-zero, and NPE value is less than 20, use the iteration method to calculate baseline.
FADC baseline option:
- Use option the average of the first 3 bins.
- If the value is not within plus/minus 0.5 mV, then take option zerobase to avoid strangely triggered pulses.
- Note that for FADC because of large undershoots, we count value only *above* baseline to get integrated charge while for ATWD, we use both positive and negative entry with the basic assumption of small undershoot effect and if we have correct baseline and we don't have any pulse in it, we get zero integrated charge for ATWD.
Click to enlarge plots.
String inclusive view
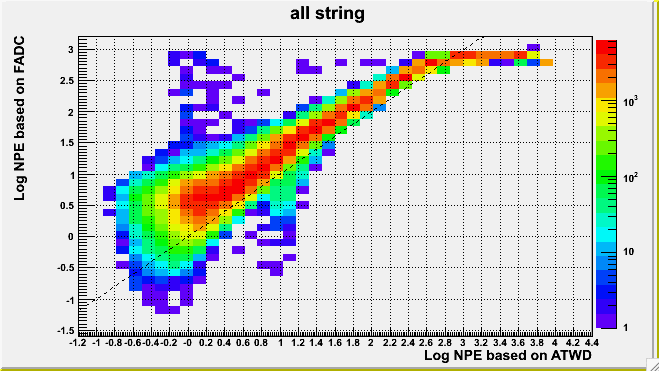
One can confirm if the baseline is appropriate by comparing NPEs based on ATWD and FADC waveforms that has different undershoot and launch properties and different baseline estimation methods.
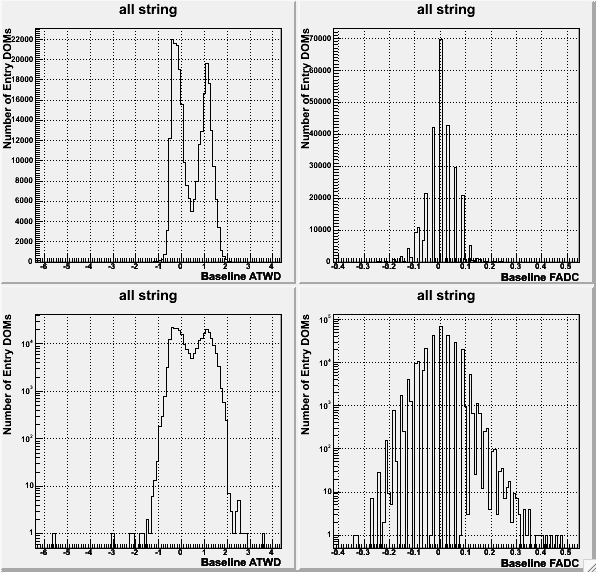
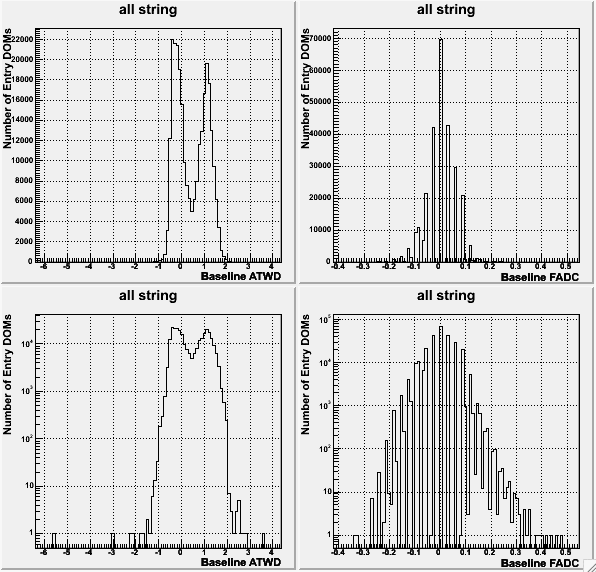
- Baseline is now distributed near origin for every strings and DOMs independent of expected NPE.
- All plots are made with both full readout bin waveforms and reduced number of readout bin waveforms and are compared.
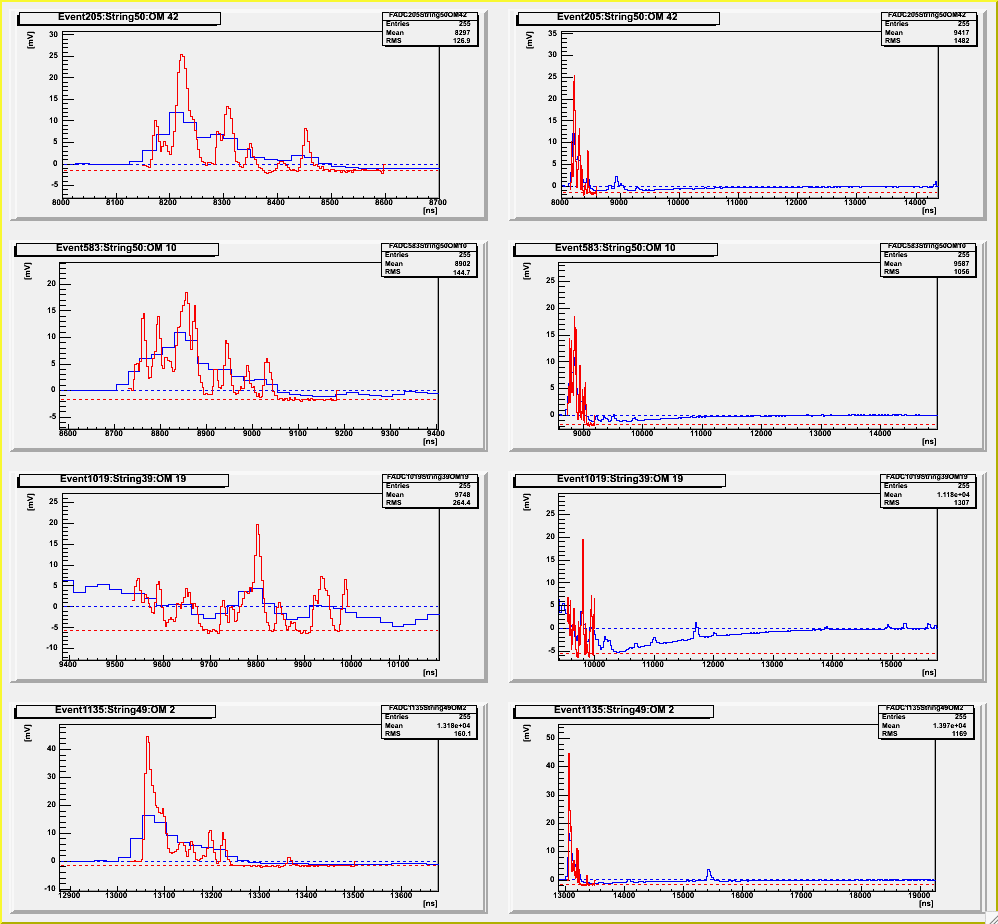
- To confirm baseline is really reasonable, I also looked over waveforms with baseline in the both ends, i.e.,
waveforms with large negative/positive ATWD baseline.
- Such waveforms (denoted by solid lines) and associated obtained baselines (dashed lines) are also shown below.
Waveforms are shown with ATWD time range on the left and FADC time range on the right.
- Note that here in the waveform plots, I shifted ATWD by 150 [ns] offset for better by-eye understanding between ATWD and FADC.
|
Baseline distribution from all 9 strings.
|
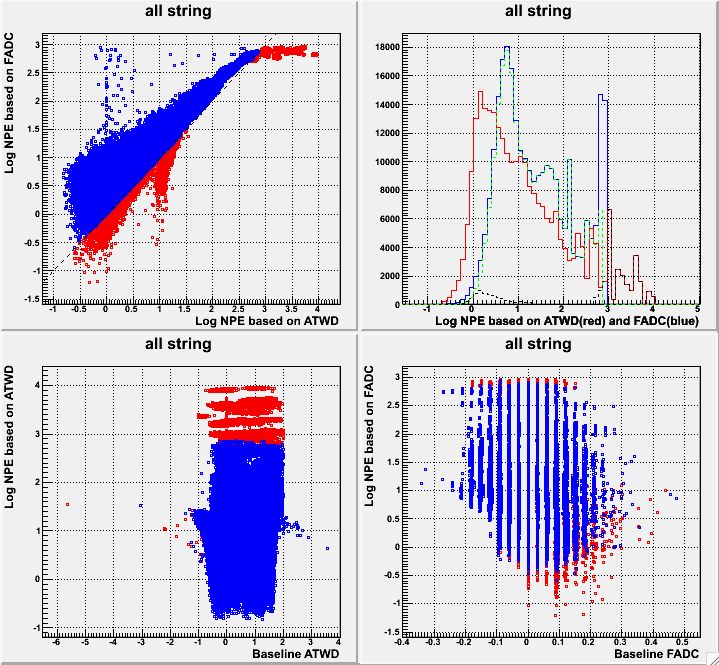
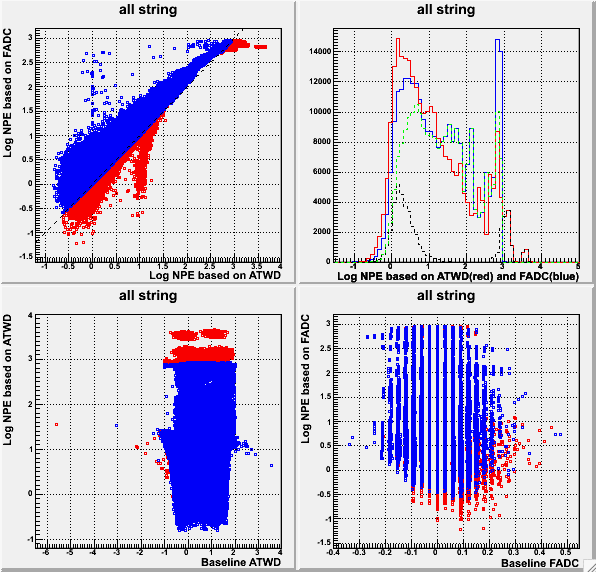
ATWD-NPE and FADC-NPE correlation and
NPE and Baseline correlation
Red indicate DOMs which has larger ATWD estimated NPE than FADC estimated NPE.
Blue indicate DOMs which has larger FADC estimated NPE than ATWD estimated NPE.
Green dashed line indicate FADC-NPE distribution which has larger value than that from ATWD.
Black dashed line indicate ATWD-NPE distribution which has larger value than that from FADC.
i.e. green dashed line plus black dashed line is the distribution of the best estimated NPE.
The lower plot is the same as upper left plot but in coltz. One can see that the mis-reconstruction from ping-pong baseline behavior still remain but contribution is small.
|
|
Baseline with Reduced Number of Bins
Here the baseline distributions are exactly the same as above with full readout N bins
|
ATWD-NPE and FADC-NPE correlation and
NPE and Baseline correlation with
Reduced Number of Bins
|
|
large *negative* baseline waveform with obtained baseline denoted by dashed line
Waveforms are shown with ATWD time range on the left and FADC time range on the right.
ATWD waveform is shifted by 150 [ns] offset for better by-eye understanding between ATWD and FADC.
y-axis is now in [mV] and x-axis is in [ns].
|
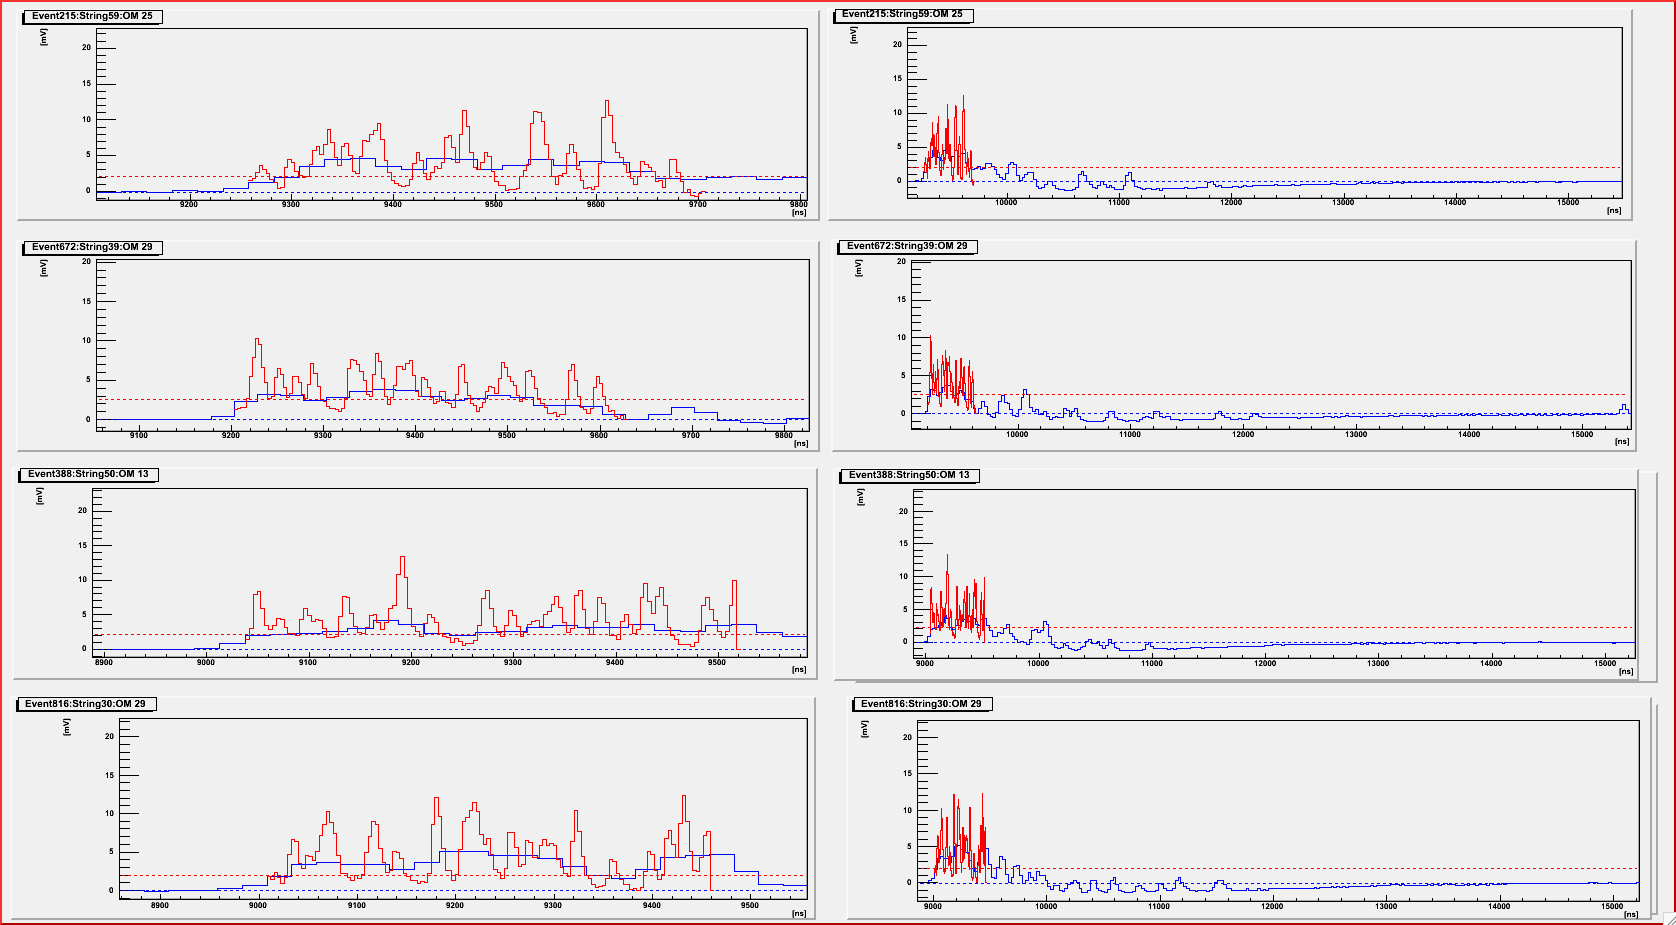
large *positive* baseline waveform with obtained baseline denoted by dashed lines
Waveforms are shown with ATWD time range on the left and FADC time range on the right.
ATWD waveform is shifted by 150 [ns] offset for better by-eye understanding between ATWD and FADC.
y-axis is now in [mV] and x-axis is in [ns].
|
ATWD and FADC based NPE correlation distribution for each strings
- ATWD and FADC based NPE distributions are now close to N_ATWD ~ N_FADC lines regardless of string position.
- The closer DOM position, the closer to the diagonal N_ATWD=N_FADC line, for the strings and doms which doesn't saturate FADC.
- With the reduced bin number waveforms, the inclination at the same DOM position is less steep as while ATWD doesn't get much affected by this bin reduction, FADC NPE is quite reduced.
|
From Left, String-40, 39, 29 and 21

|
|
Reduced Number of Bins
From Left, String-40, 39, 29 and 21

|
ATWD based NPE for each strings
Black denoted results from full bin readout
Red is from the reduced bin number readout
- NPE distribution based on ATWD is compared with full bin and reduced bin.
- Only saturation level is changed for ATWD (not the time window), the effect of bin reduction appeared in the closest DOMs to the SC candle.
- At the closest DOMs, the reduction is more than a factor of 2.
|
From Left, String-40, 39, 29 and 21 near SC position

|
|
From Left, String-40, 39, 29 and 21 away from SC Position

|
FADC based NPE for each strings
Black denoted results from full bin readout
Blue indicate from the reduced bin number readout
- NPE distribution based on FADC is compared with full bin and reduced bin.
- The effect of time window reduction on FADC can be seen. The further the DOM position, the more reduced.
- At a far DOMs (~250 m away from SC, for example), the reduction is about a factor of 2.
|
From Left, String-40, 39, 29 and 21 near SC Position (DOM#>10 && DOM#<30)

|
|
From Left, String-40, 39, 29 and 21 away from SC Position (DOM#<10 || DOM#>30)

|
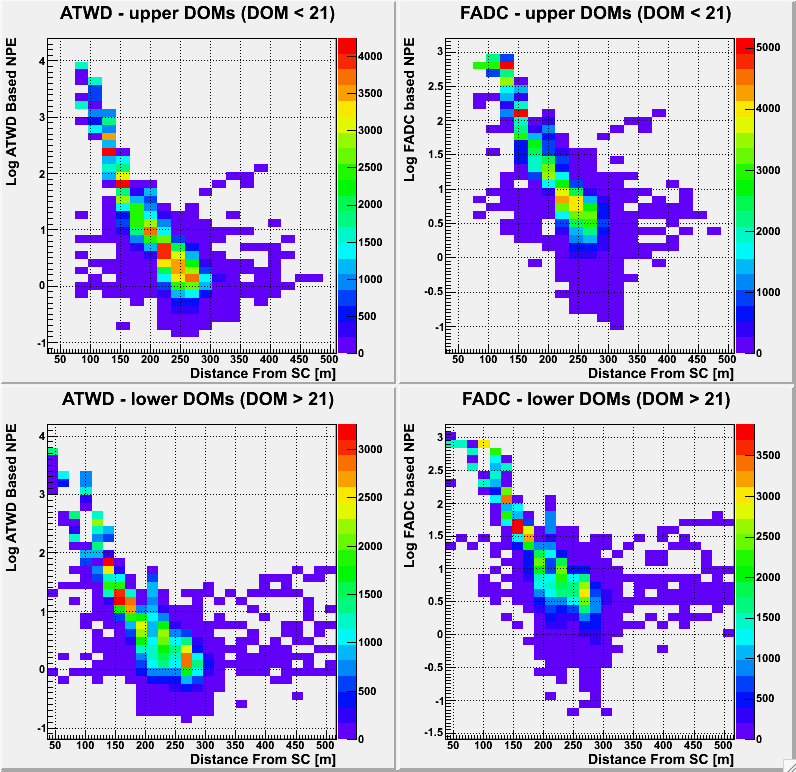
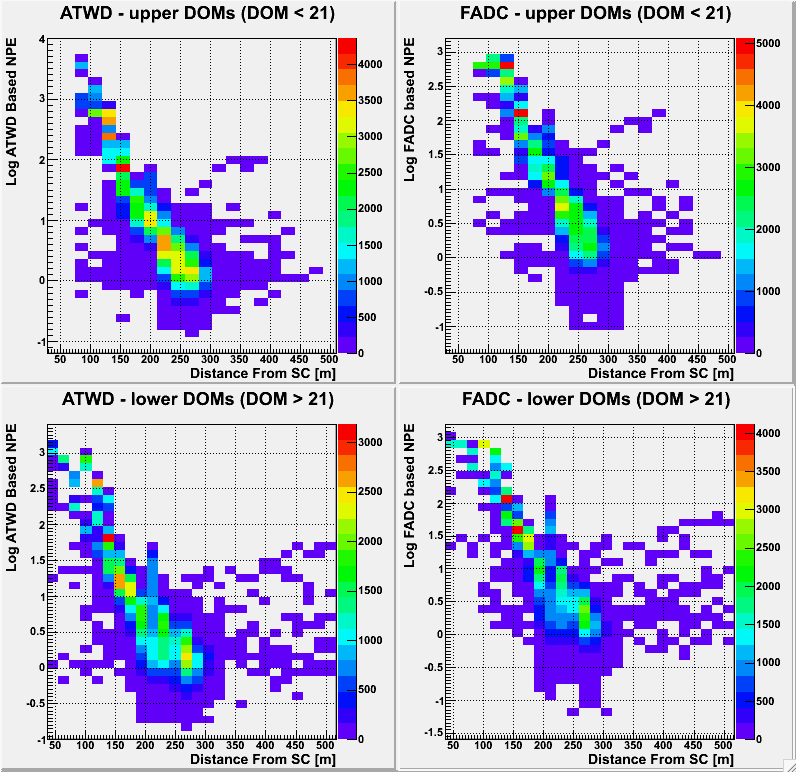
NPE vs Distance
Here obtained estimated NPE for ATWD (left) and FADC (right) is plotted as a function of distance for upper DOMs (above the SC position) and lower DOMs (below the SC position).


