Hardware Operations
This section will discuss operation and inspection of hardware components in the FAT laboratory required for the D-Egg FAT testing as of 2021 Spring.
Freezer
Operating the freezer is straightforward, but is required knowledge for all shifters. Please familiarise yourself with enabling/disabling the thermostat and setting the temperature. This is because the freezer themostat is not digitally controlled and must be operated manually.
Operation
To enable or disable the thermostat, operate the switch on the side of the freezer. It may take a few minutes for the light to turn green.
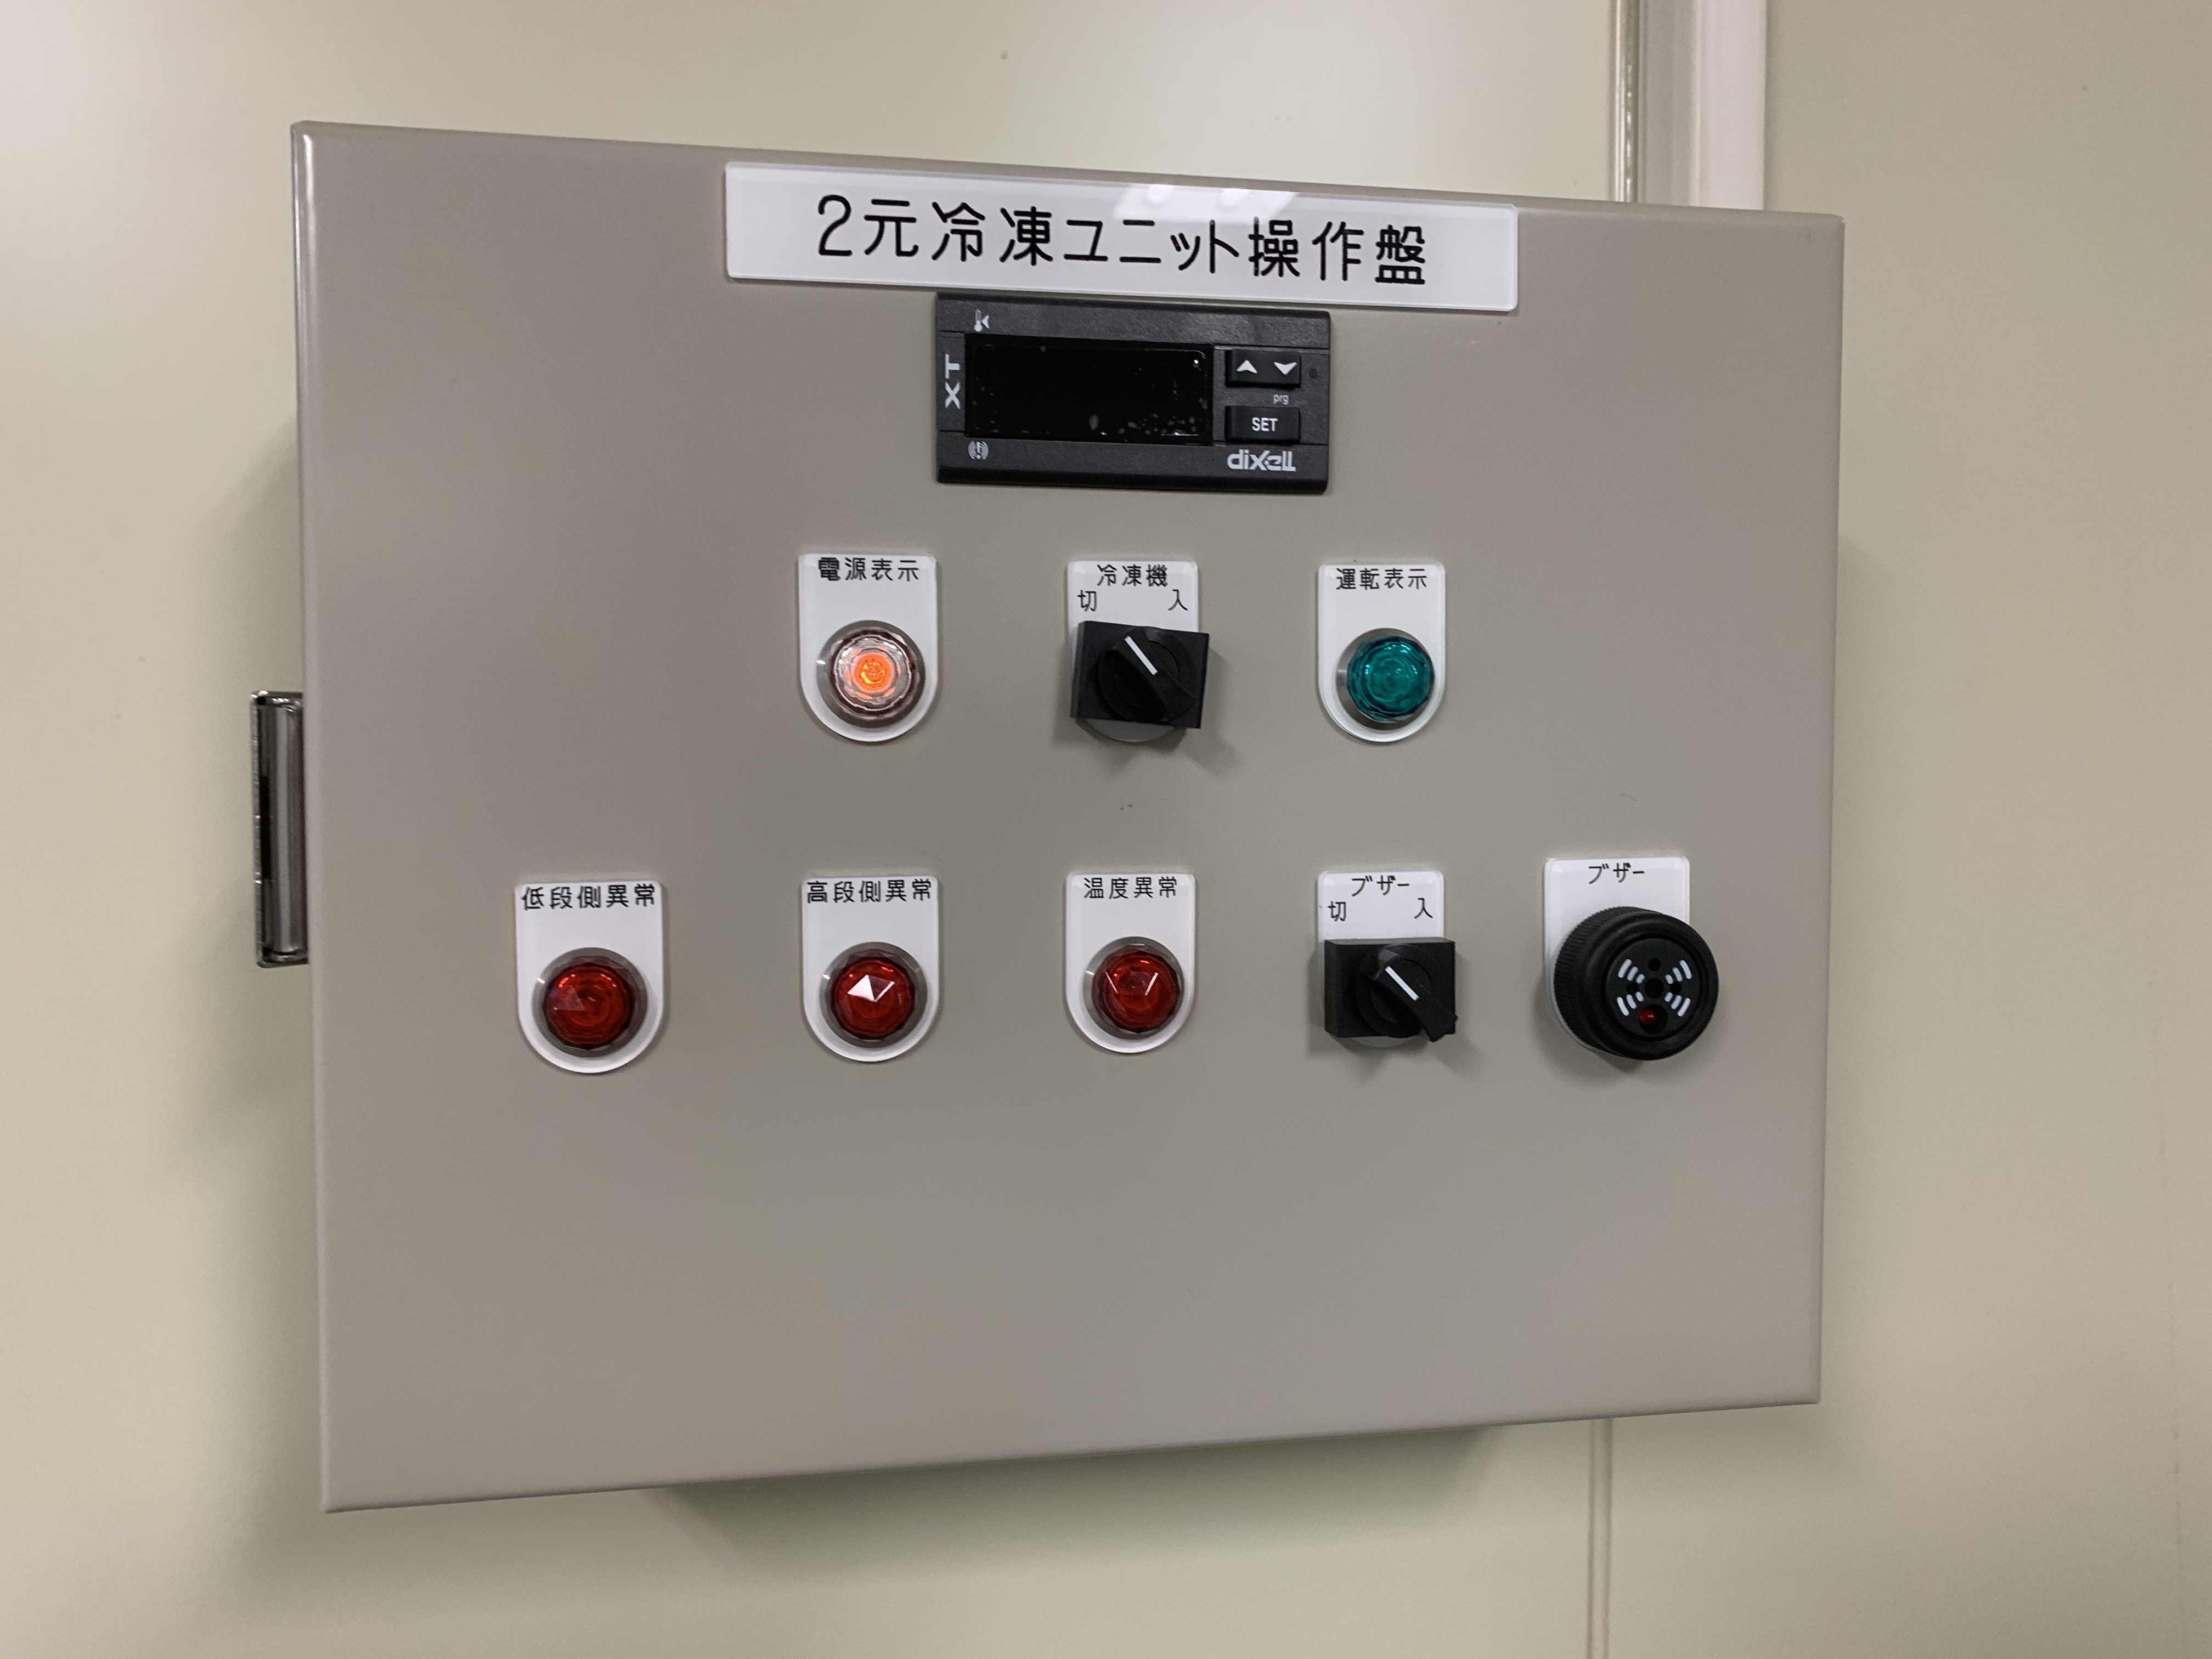
To adjust the temperature, hold down the “Set” button for several seconds. Use the up or down arrows to set the freezer temperature. Temperatures we will use in the FAT are: -40 and -20.
The freezer takes several hours to cool down
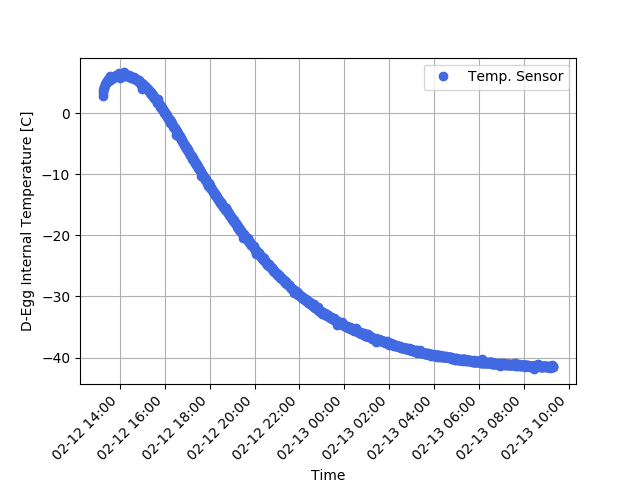
but can take a very long time to warm up (~days).
Before enabling the freezer, check that there are no large concentrations of water on components or the floor inside the freezer. If so, try to remove some with a cloth or sponge. Otherwise, wait and contact an expert shifter.
Dehumidification
During the warming process, the freezer becomes very humid due to ice collected on components melting. To hopefully mitigate the amount of water concentrated inside the freezer, before opening perform a dehumidification cycle.
When the freezer reaches 10 degrees, turn the freezer back on.
Wait until the freezer returns to -10 degrees.
Repeat ~5 times.
(This technique was suggested by Gen1 engineers, but had limited success) The alternative is to install dehumidifiers once the temperature rises above 0 degrees. This procedure will require disabling the D-Egg high voltage to safely open the freezer.
Optics System
The optics system relates to all components used to control components inside the optics box. This includes the laser, programmable filter wheel, function generator, and any reference PMTs. In general, this setup should need very little intervention between FAT cycles. All of this setup is required to transport the laser light into the freezer via optical fibres. The exception are the two table-top mainboards, which will be described later.
Laser
The laser consists of two parts: the control (outside the black box) and the output (inside the black box). Only under very rare circumstances does the laser output need to be moved, as it has been aligned with the optics system. It is best to not open the optics box if not required. Please be careful when working close to the optics box to not move anything.
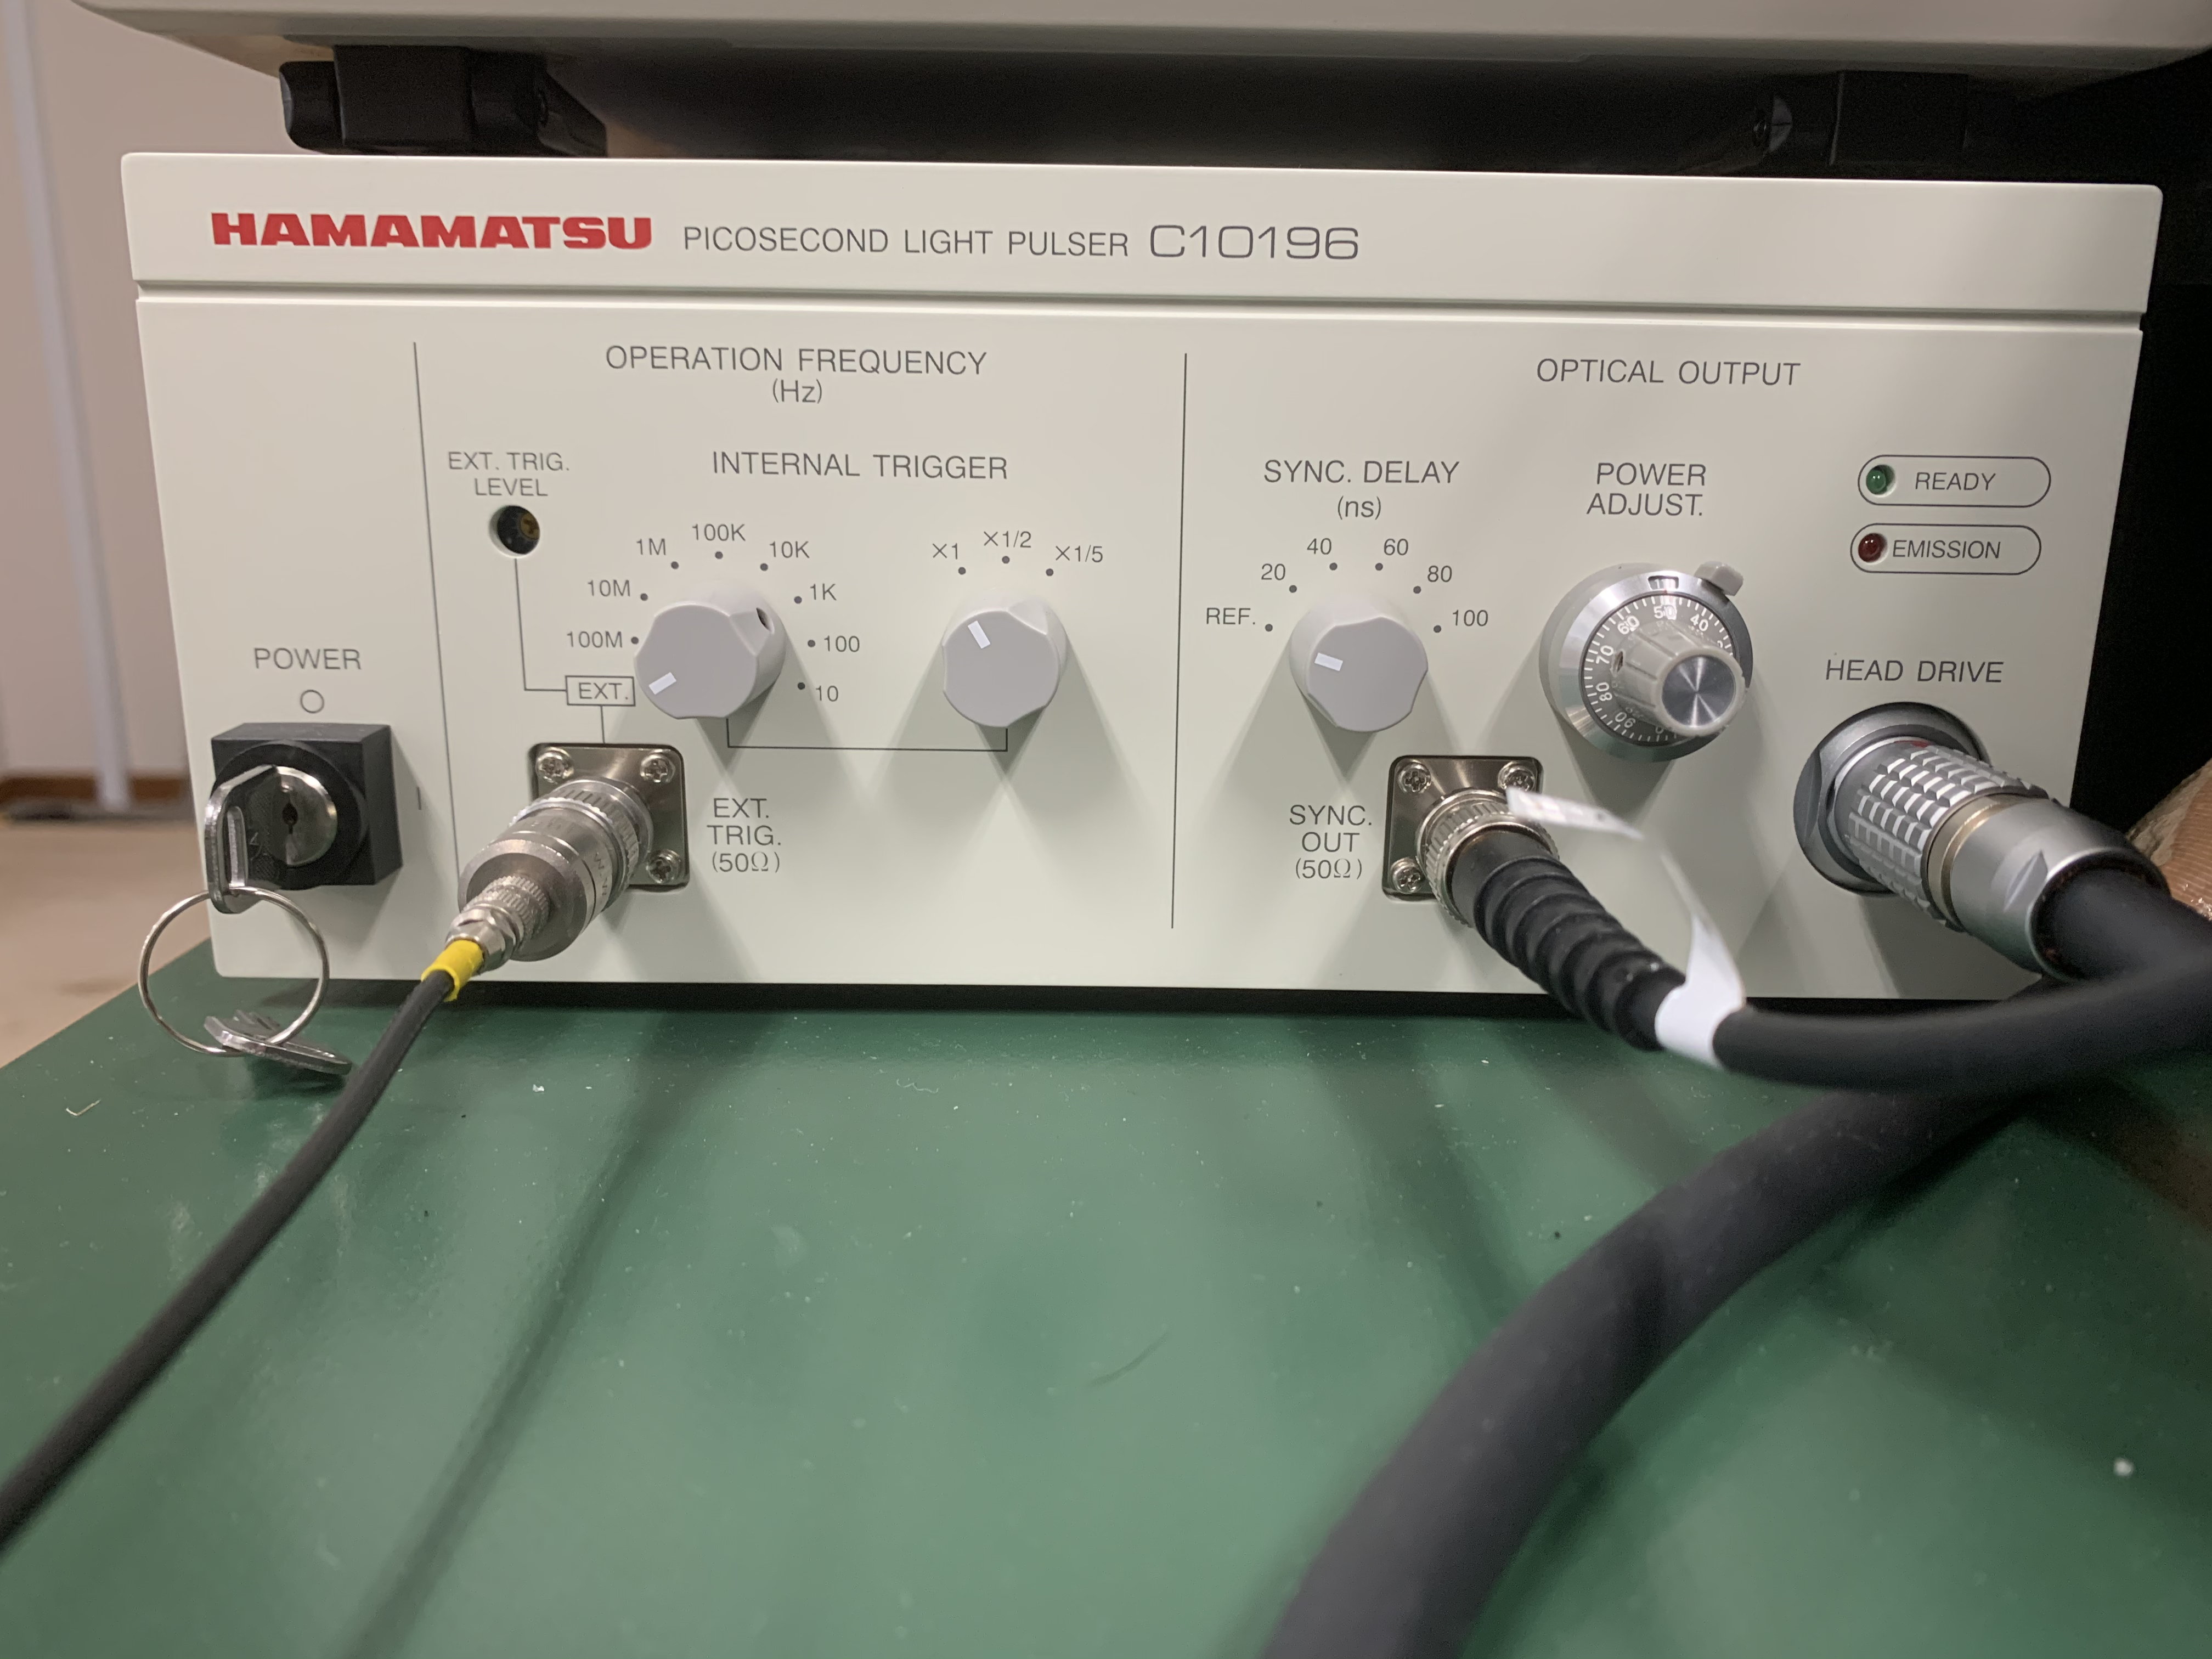
The control has options to modify the laser frequency and intensity. It also supplies the external trigger (EXT) to the mainboards. The intensity has been tuned to around 11.5. Do not modify the laser intensity When working inside the freezer, be sure to disable the laser by turning the key. You can tell the laser is off if the green power light is off.
To make sure the laser is configured for the FAT: make sure the frequency is set to “EXT”, ensure the limo cable is connected to the sync-in and funcion generator, and check that the coaxial cable is connected to the sync-out.
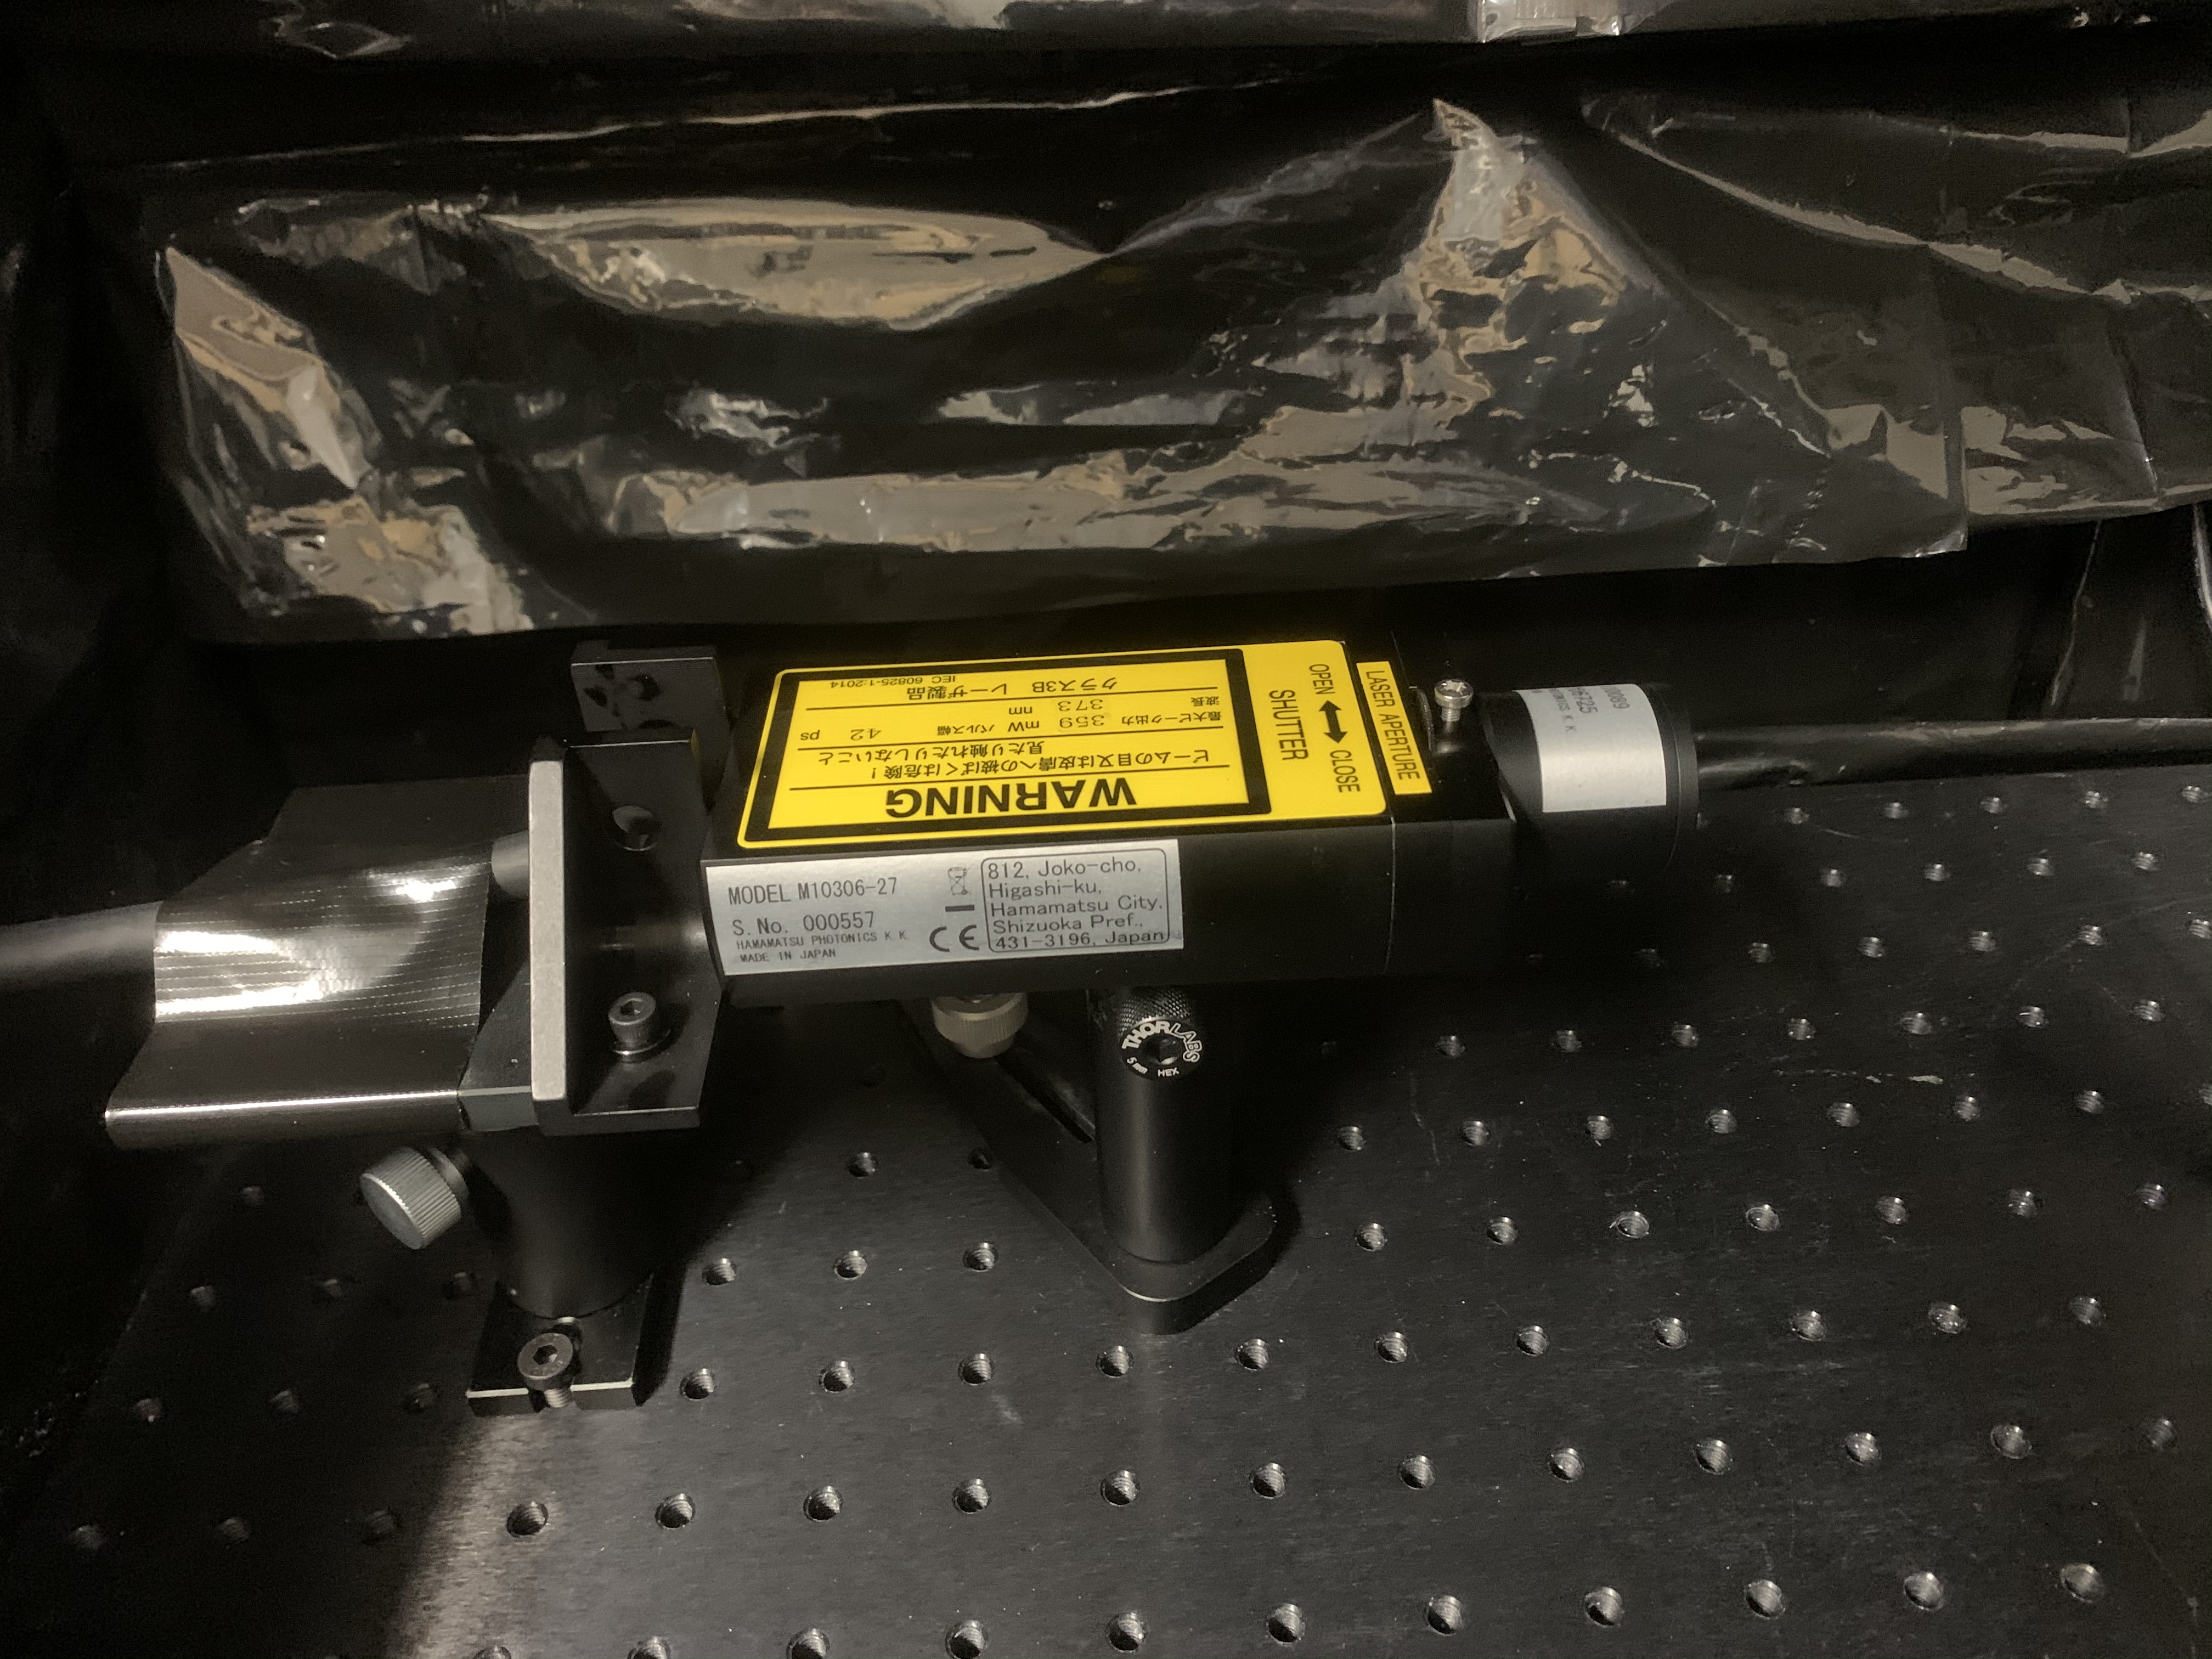
The above photo shows the laser output located inside the black box.
Function Generator
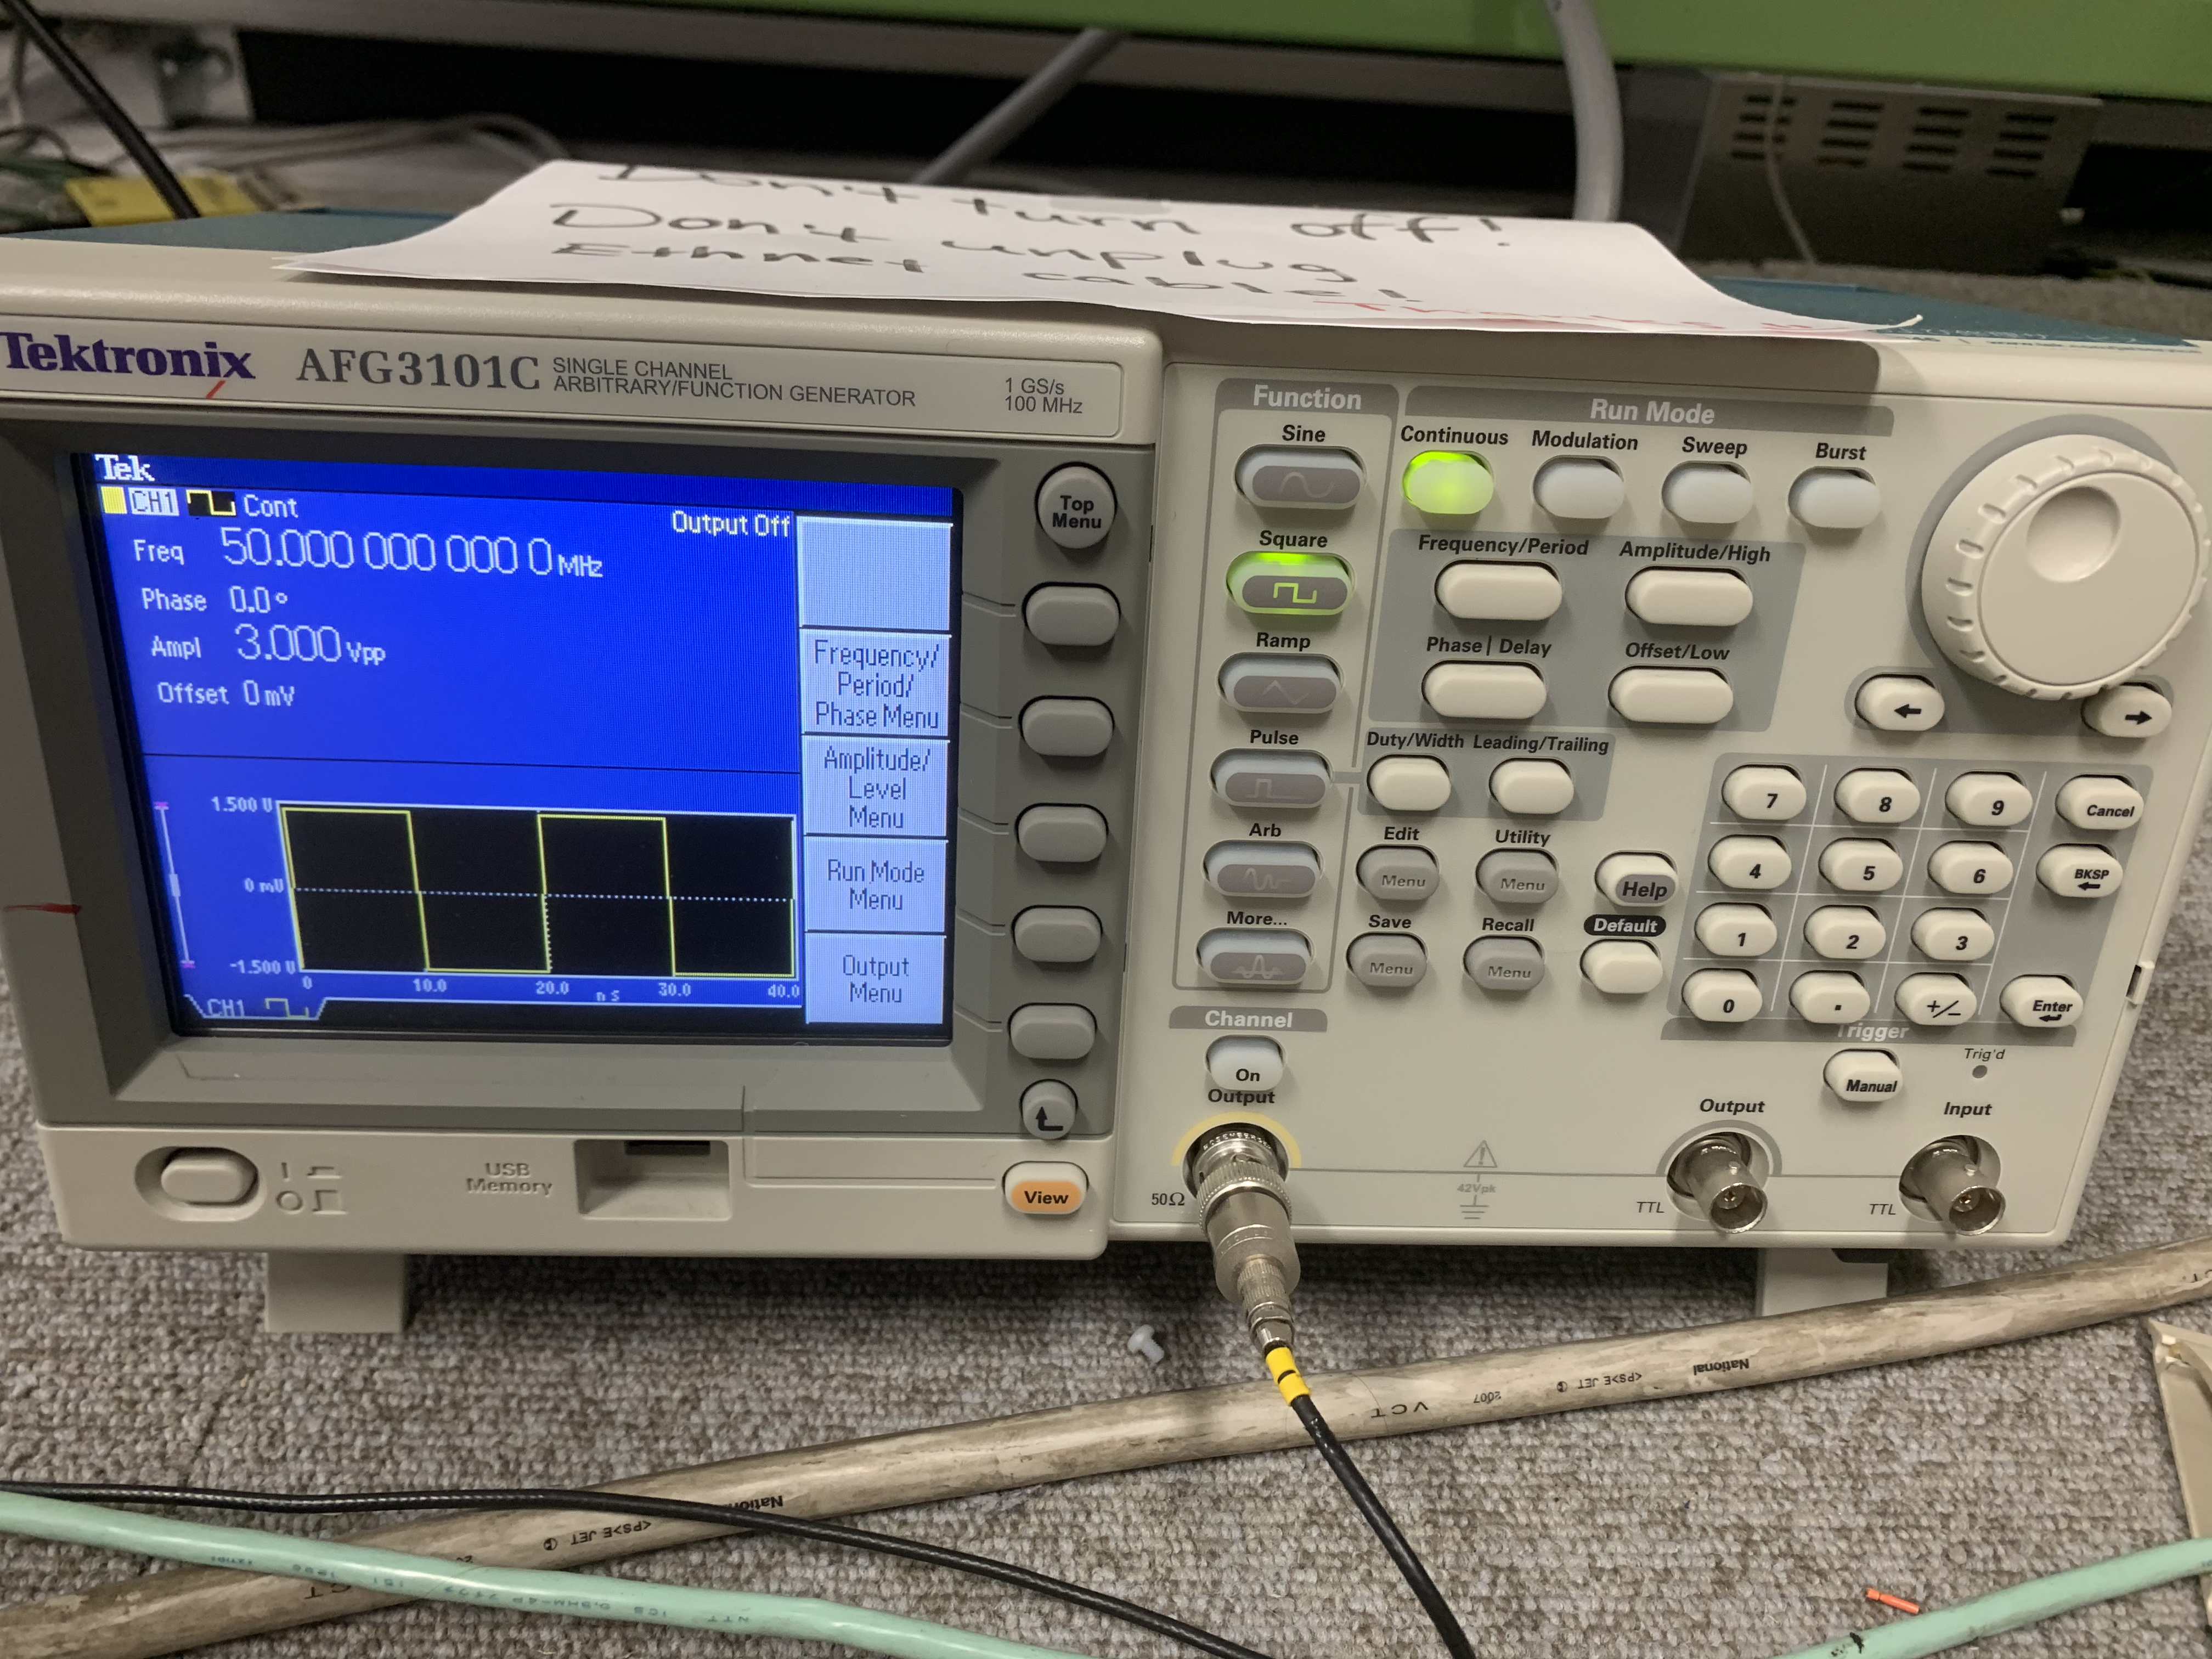
The function generator (under the table) is how we control the laser in an automated way. You can notice that the function generator supplies the laser control box with an input signal.
Make sure the function generator is turned on and that the connected GPIB (yellow box) connector ethernet ports are illuminated. Before beginning the FAT, restart the function generator manually by pressing the power button, waiting 2 seconds, and pressing the power button again. This is a precaution due to an observed shift in the laser output frequency following sustained output. We will also test the software connection (coming later).
Filter Wheel
The two programmable filter wheels allow us to reliably and automatically control the laser intensity. They are located inside the black optics box and have 6 settings each. Filter wheel 1 is located on /dev/ttyUSB0 by default and has 100%, 25%, 32%, 5%, 100%, 100% as its settings. Filter wheel 2 is located on /dev/ttyUSB2 by default and has 100%, 1%, 10%, 50%, 100%, 100%. Filter strengths of 100% correspond to simply an empty slot. These give a range of approximately 1 to 500 PE for D-Eggs located inside the freezer. The intensity range depends somewhat on which fibre the PMT is located at. The various settings are particularly useful for the PMT linearity measurement.
In general, the filter wheels are always configured to be on. Again, we will test connections to the filter wheels in a later section. If you wish, you can confirm the filter wheels are working by pressing the up or down arrows located on the device. When opening the optics box, disable the laser and any high voltage.
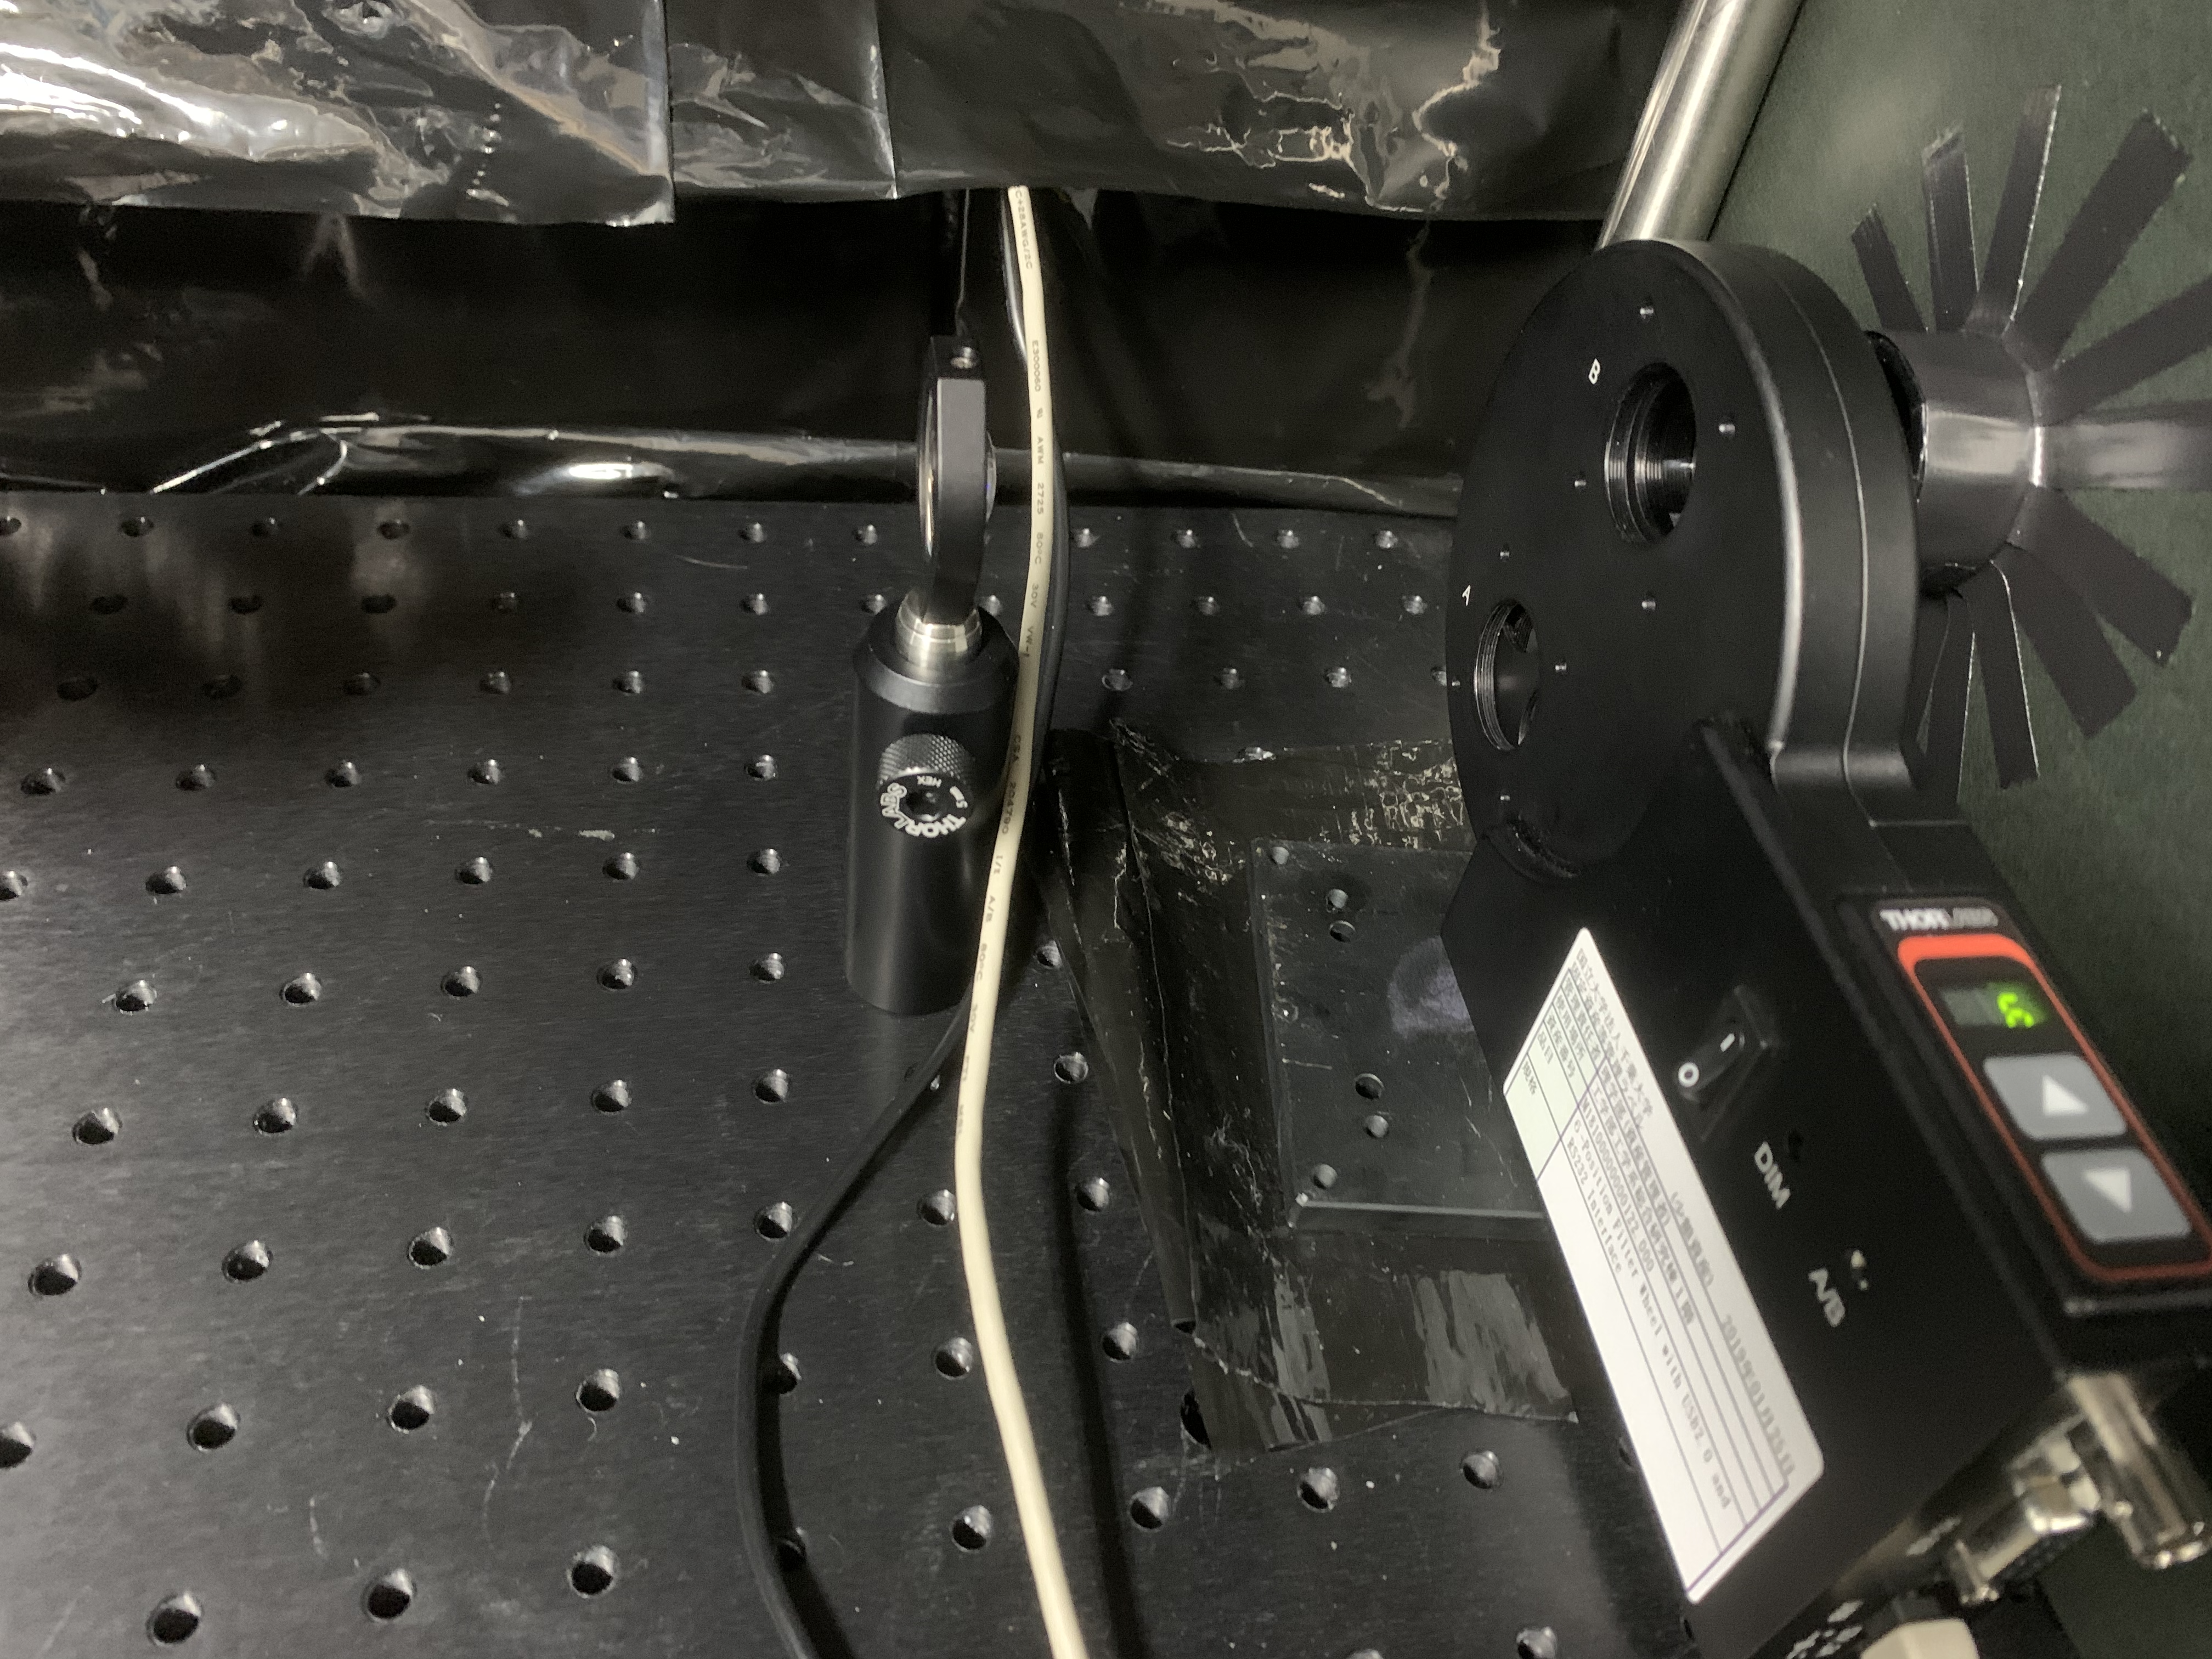
This image shows the filter wheel located inside the black box. You can see the colimating lense, which focuses the light coming into the filter wheel. When enabled, the LEDs display which position the filter wheel is set to. These lights are automatically disabled during the FAT.
Filter wheel combinations used for the linearity measurement are as follows: (1.0, 0.01), (0.05, 0.5), (0.05, 1.0), (1.0, 0.1), (0.25, 0.5), (0.32, 0.5), (0.25, 1.0), (0.32, 1.0), (1.0, 0.5), (1.0, 1.0).
Optical Fibres
The optical fibre is a 1:34 channel (1 spare) set of light-guides which transport the laser light from the black box to the D-Egg PMTs inside the freezer. Currently 1 of the optical fibre channels is damaged and labled as such. Do not use it. Here you can see an image of the input-side of the optical fibre.
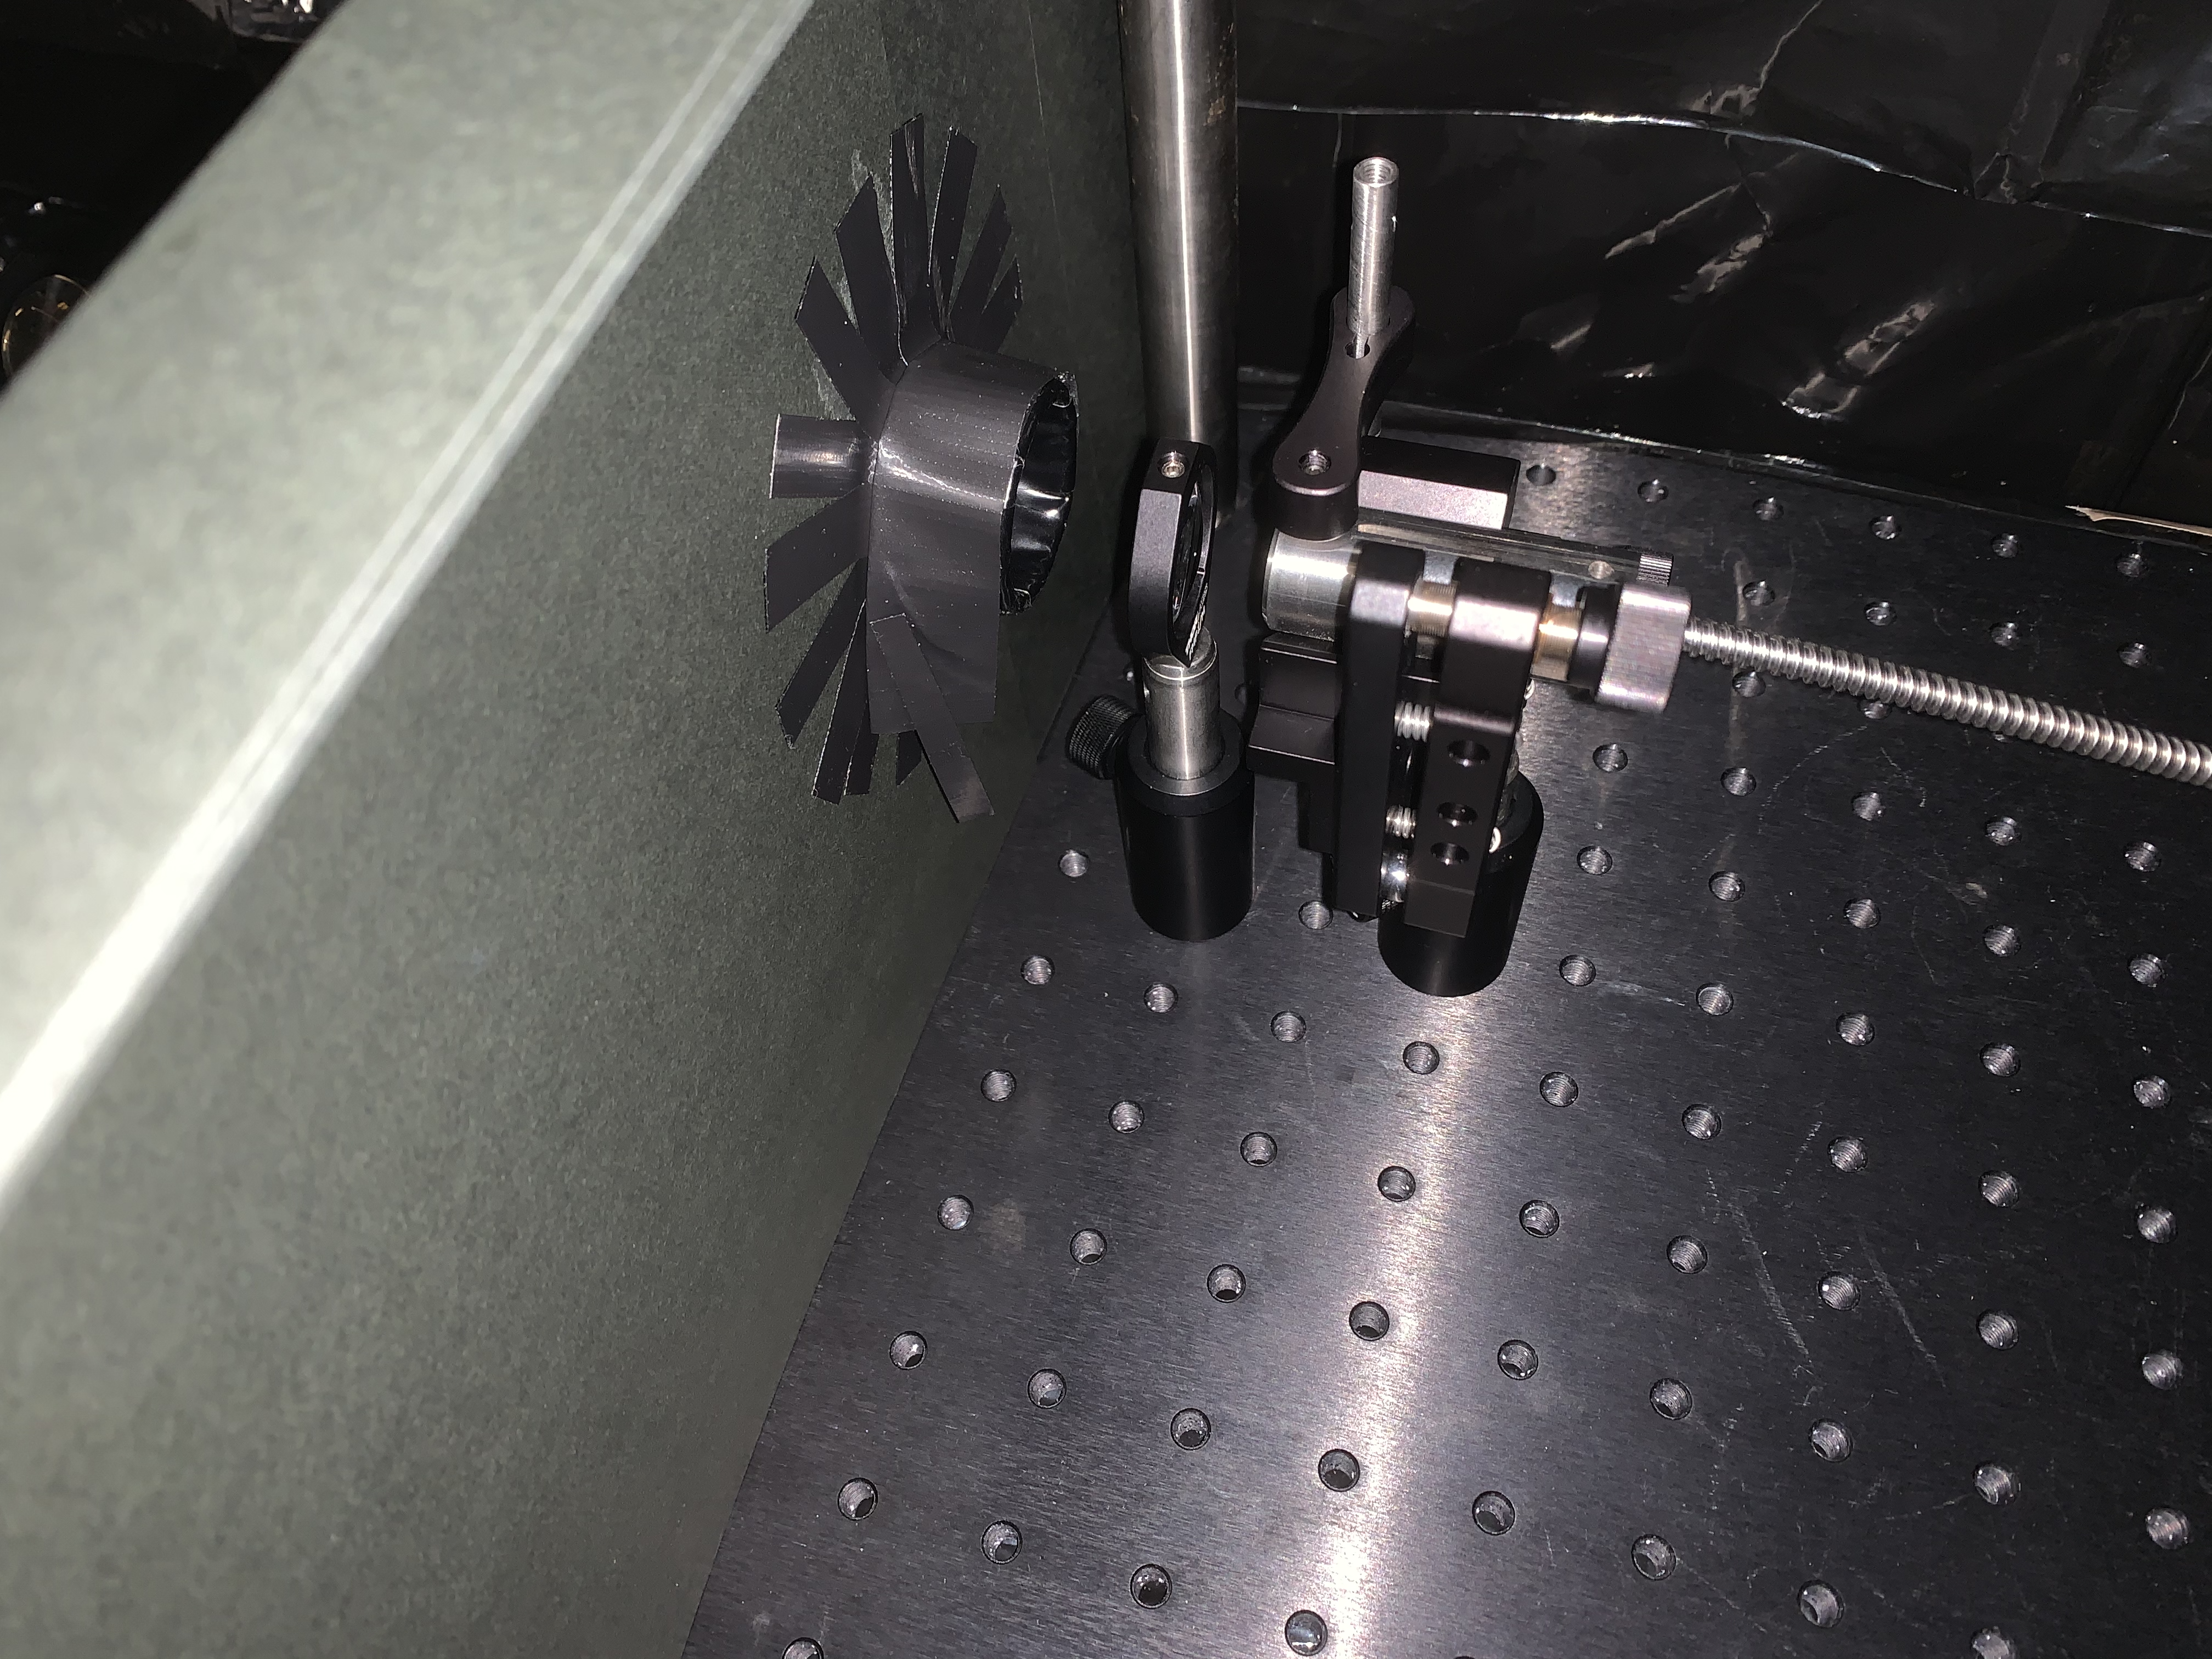
Additionally the thick black paper blocks any uncollimated/scattered light from entering the fibre.
Jumper Boxes
Jumper boxes are the rack-mounted series of Dsub-9 ports. These Dsub-9 ports allow communication between the D-Eggs in the freezer via the comm cables (red cable). You can see to which box inside the freezer each red comm. cable leads, in the same way that the optical fibres are labelled. The connector on the top left of each jumper box leads to the mini-fieldhub.
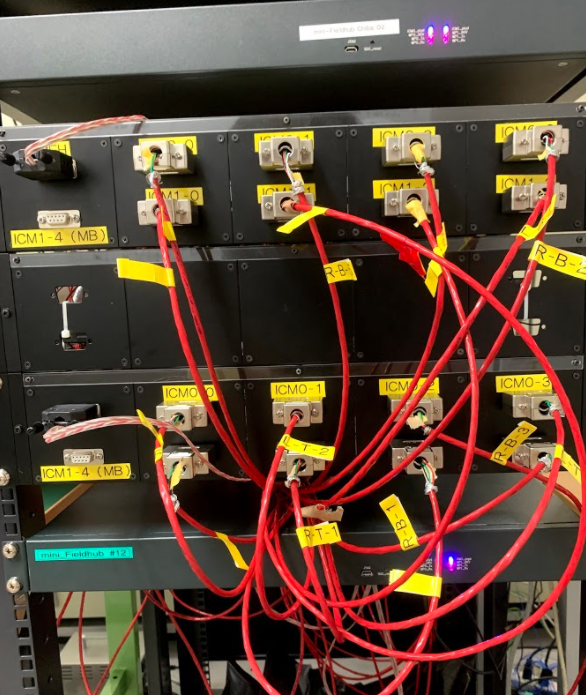
To get a full understanding of the jumper box design, you will need to understand the construction of the D-Egg comm. cable. These cables contain 6 wires - 2 are used for + and - power, while 4 are used for “addressing”. Instead of modifying the comm. cables themselves, the jumper box creates unique combinations of the 4 addressing wires. The unique combination is then used to correctly assign the D-Egg to a given electrical port (the electronic path), needed in software.
The order the cables are attached is important. During standard operations there should be 18 red comm. cables plugged into the jumper boxes, along with two connectors using ribbon cables leading to the mini-fieldhubs. They should not require any attention or modification. If you notice this is not the case, please contact an expert.
If any cable appear to be unplugged or loose, contact an expert shifter. Do not touch jumper boxes when high voltage is enabled!
Mini-fieldhubs
The 3 mini-fieldhubs are rack-mounted and labled. The first and second mini-fieldhubs supply the D-Eggs. Inside, each mini-fieldhub has 2 icecube communications modules (ICMs). These are required to communicate with the ICMs located on the D-Egg mainboards.
Each of these mini-fieldhubs (MFHs) has a Dsub-9 connector leading from its back to the top-left of the jumper box. One jumper box per mini-fieldhub means that 8 D-Eggs are connected to each. To join the MFHs to the PC, and thereby the D-Eggs to the PC, both MFHs have a USB cable connecting from the back to the PC. These cables should be plugged into a USB hub taped to the PC table. Power cables are also located in the back, next to the green power switch.
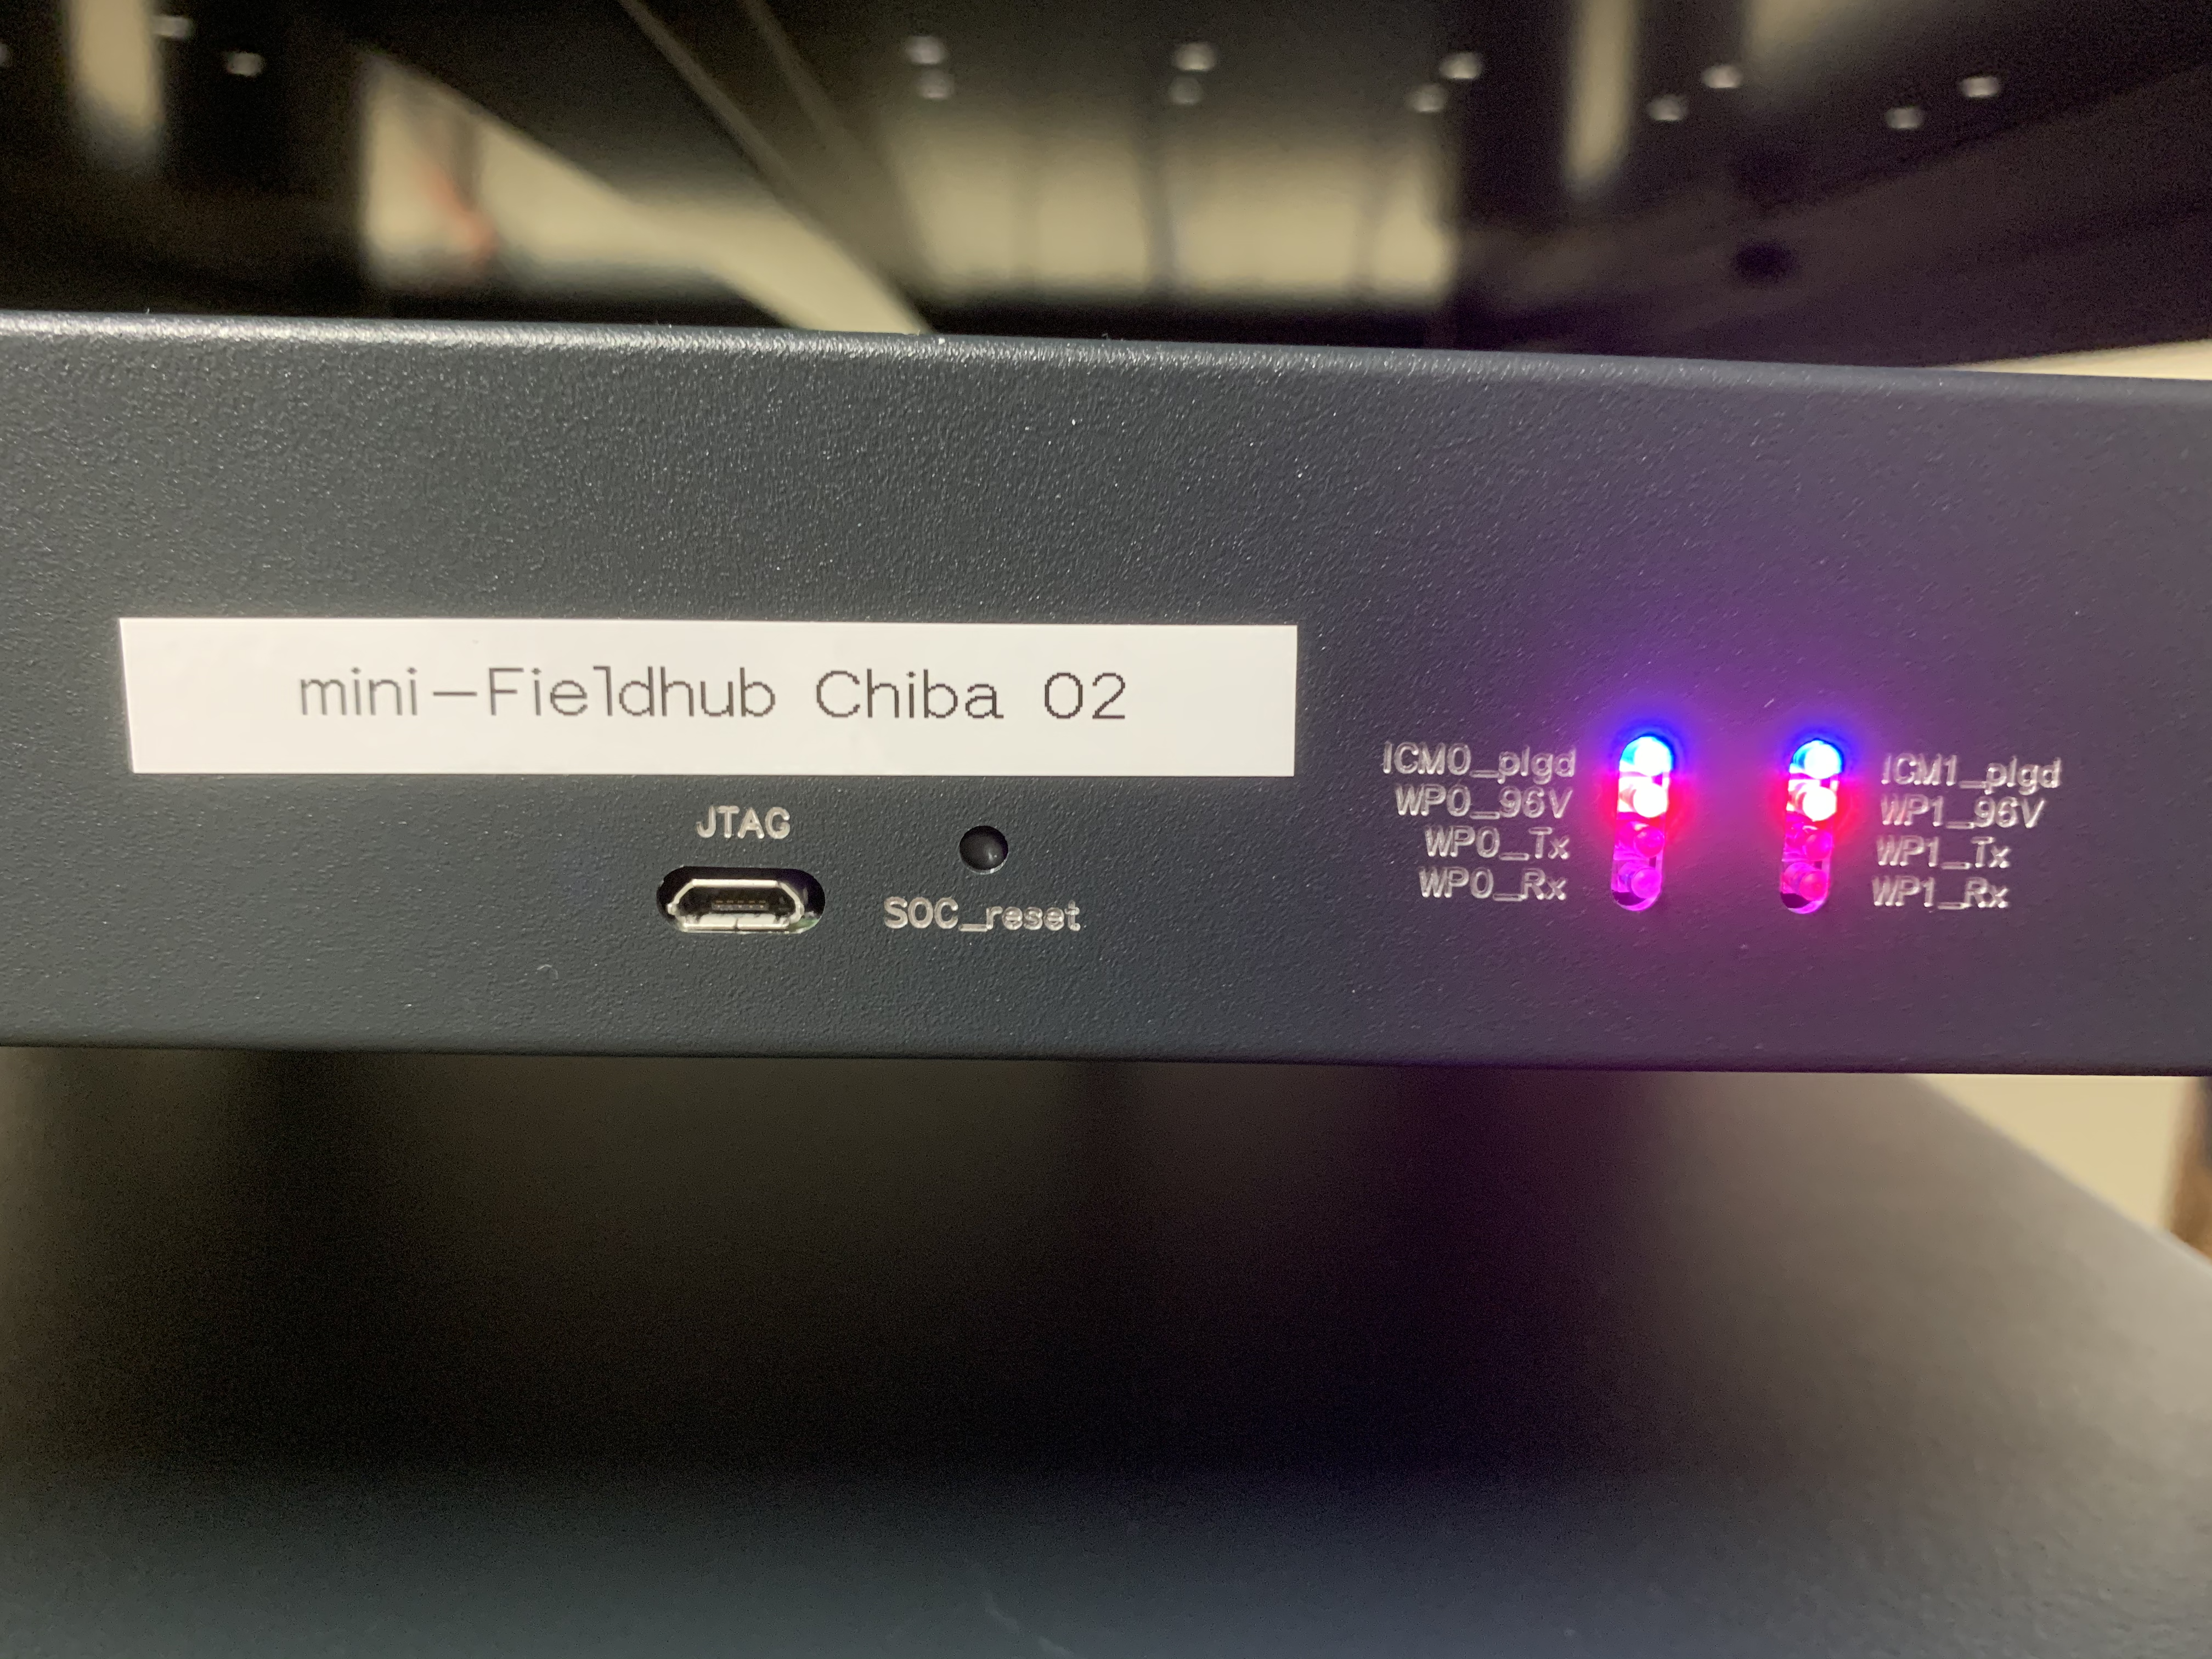
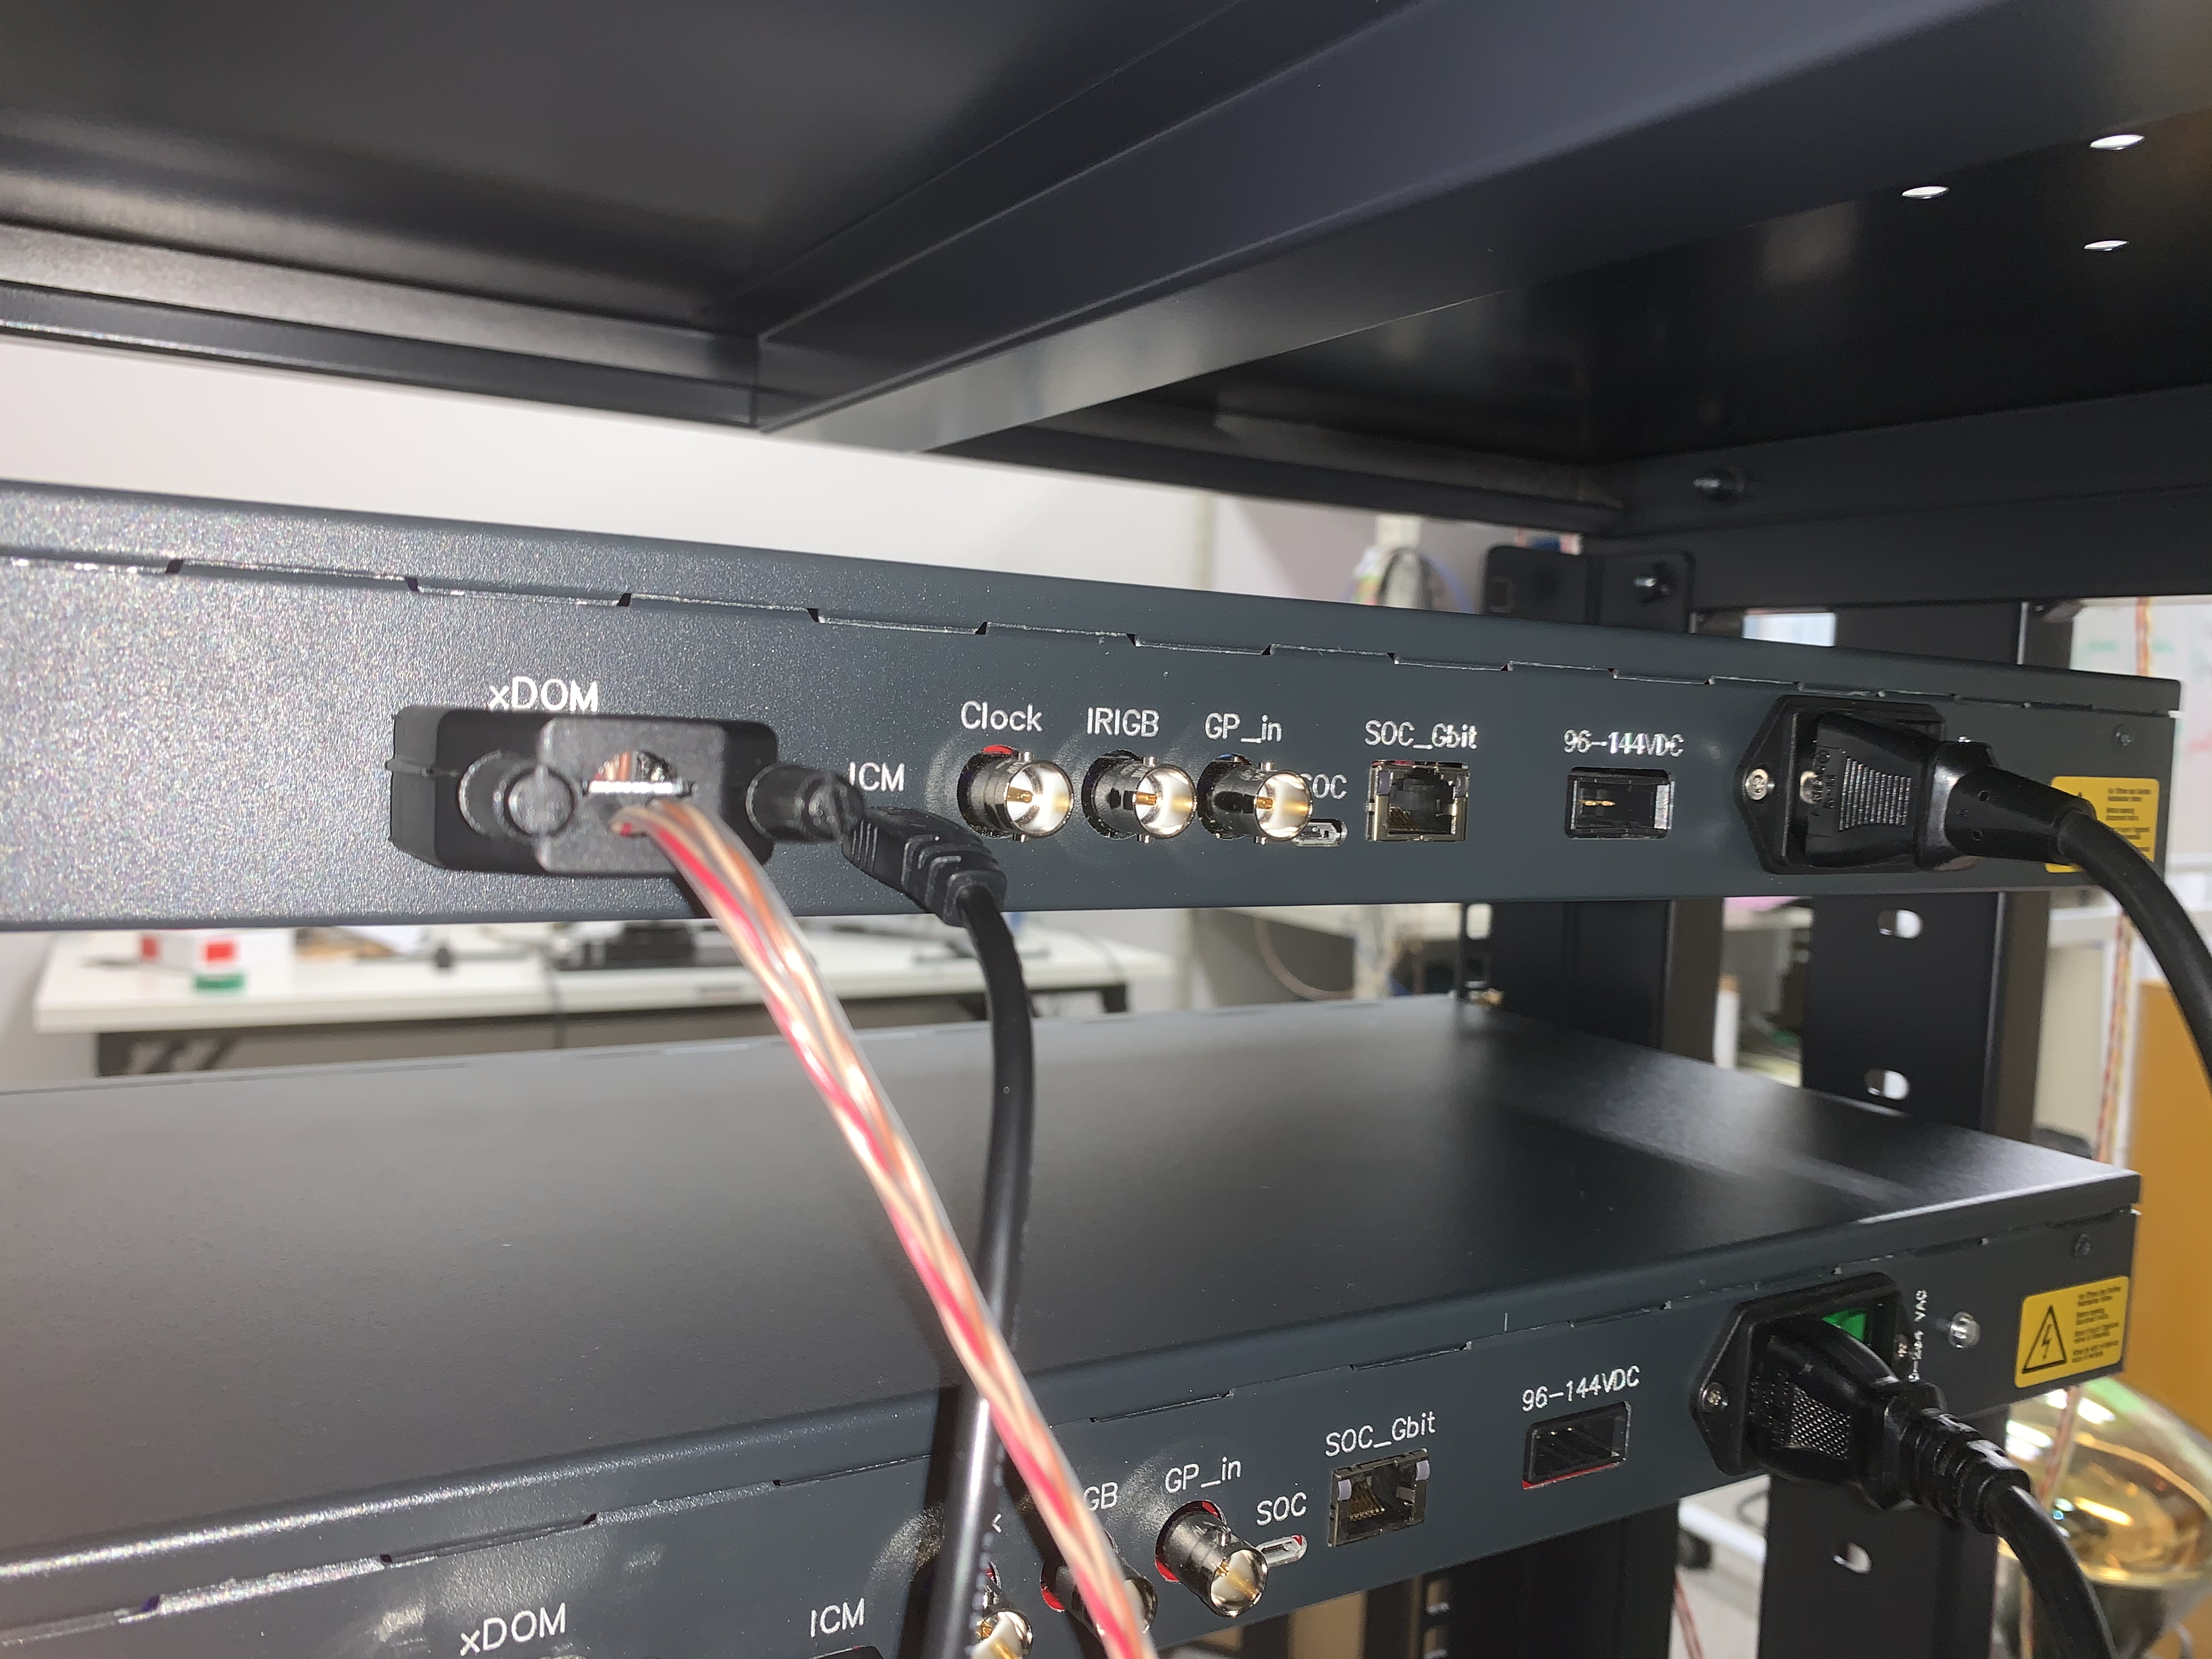
To operate the mini-fieldhub, simply flip the green power switch. When power is enabled, the series of LEDs will illuminate. The two columns of LEDs corresponds to an ICM each.
In a single column the LEDs correspond to:
Top LED reports that the MFH is receiving power.
Second LED reports that something is connected to the Dsub-9 (should always be the case, given the jumper box).
MFH ICM is transmitting information.
MFH ICM is receiving information (typically from a D-Egg mainboard).
If the top two rows of LEDs are not illuminated or the lights are constantly flashing, contact an expert
Lastly, the MFHs each have a grounding wire attached. For safety reasons, make sure this wire is attached whenever you operate the MFHs. If for some reason the grounding wire has become detached, please re-attach it as shown in the photo.
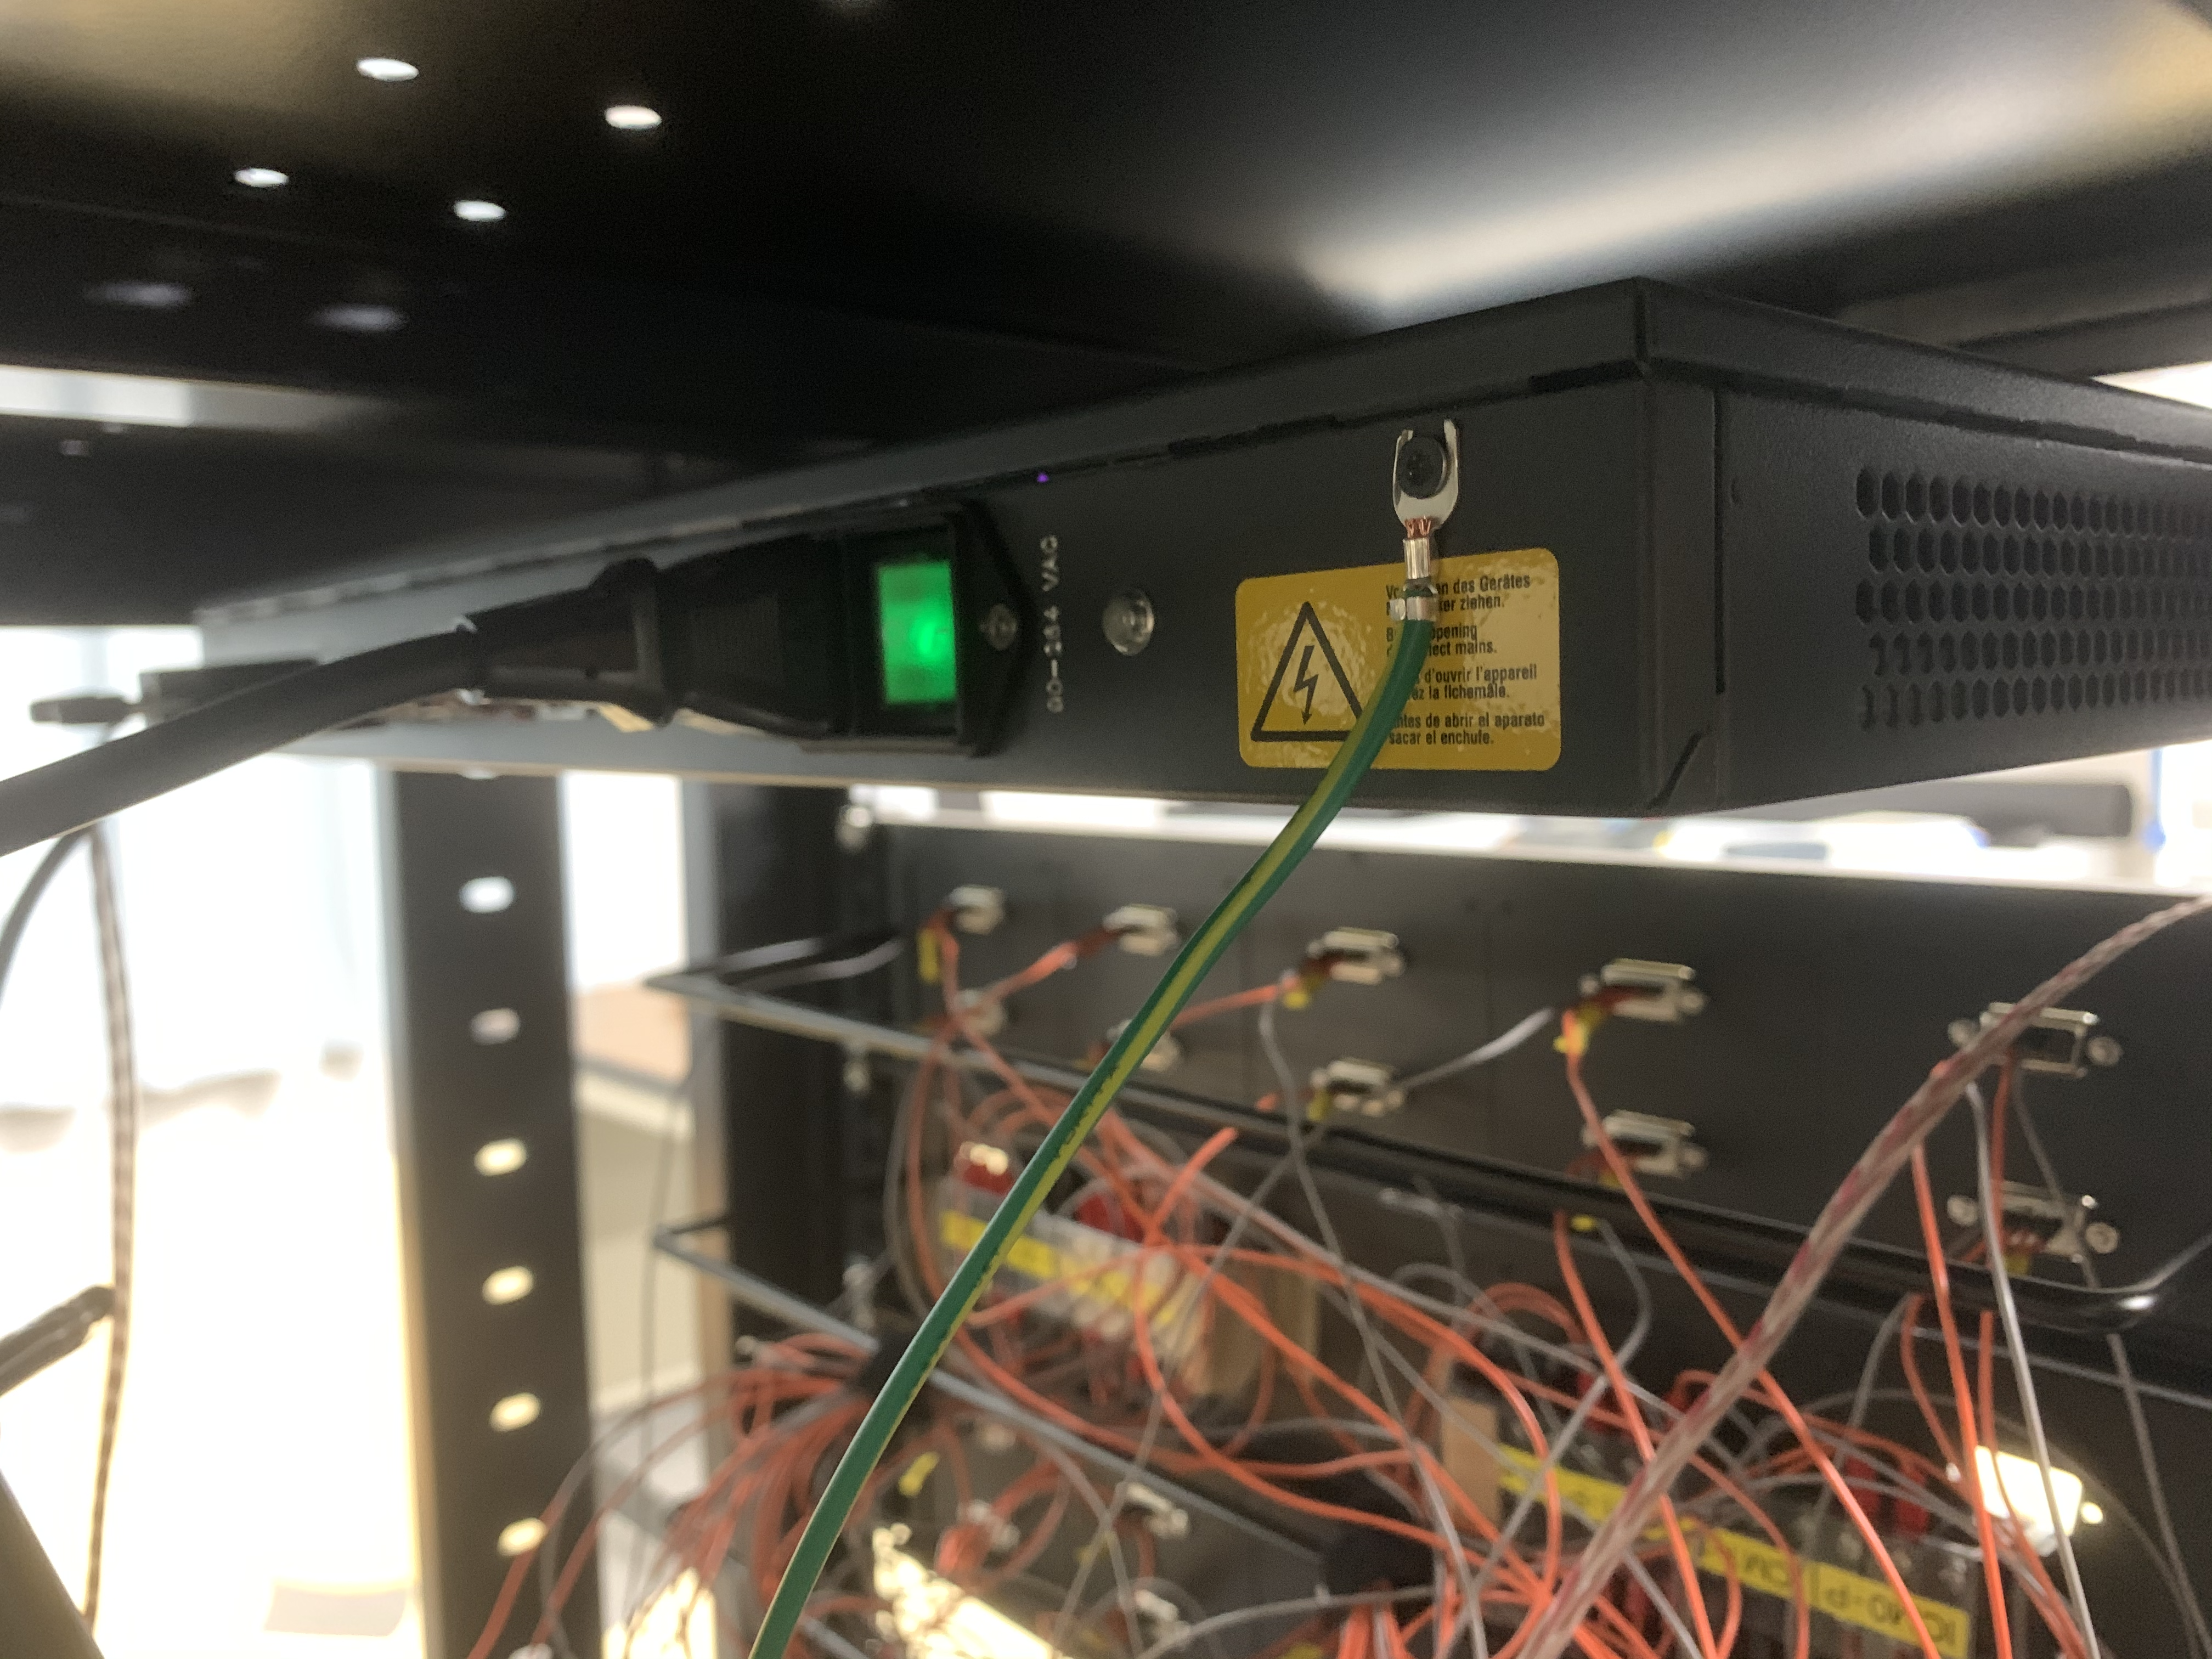
The connections to the ICM and USB are very fragile - do not touch them.
Table-top Mainboards
While The mainboards are normally located inside the D-Eggs, one mainboard is mounted to the rack outside. When sealed inside the D-Eggs, the mainboards are (obviously) unable to receive the laser EXT (physically!). Therefore to record the timing information of when the laser fires, the table-top mainboard record this time.
These mainboards receive the laser EXT trigger physically through the SMA connector at J1. Briefly check that the mainboard has the cable connected to the laser EXT and that the connection is secured (also at the SMA to BNC connector). Also confirm that the red power cable leading into the mini-fieldhub (labled “3rd”) is secure. The connector on the mainboard is extremely delicate - do not move the mainboard without carefully disconnecting first
GPS System and the PPS Connections
Each mini-fieldhub ICM has an internal oscillator, but to bring them all into the same reference frame (UTC time), they are all connected to the GPS. This then allows for conversion between internal D-Egg mainboard times and UTC time. The GPS system is the core piece of hardware required to extract timing information. It consists of: the GPS antenna, the GPS electronics device, and the signal splitter/inverter.
Antenna
The GPS antenna is a small beige-coloured, mushroom-shaped object used to connect the GPS electronics to satellites. To maximise exposure to the sky, the antenna is mounted in the window, taped to a cardbord tube for stability. From the bottom of the antenna runs the signal cable to the GPS electronics. Unless absolutely necessary, do not move the antenna as this can inadvertantly trigger a calibraiton sequence from the electronics or result in loss of satellite signal.
GPS Electronics
The electronics control the GPS system and provide the interface for us users. Power is supplied via the rear of the device and enabled with a switch. The antenna cable is also connected in the back and should be secured. Do not touch this unless you suspect an issue with the module.
The front panel provides plenty of useful information to determine if the GPS is functioning as expected. The first is the LED “Power” - this should be illuminated. If not, enable the GPS power using the switch on the back. Note that after enabling power, the GPS will need close to 30 min to finish its startup procedure. A clock (UTC time) should be counting up, displaying the current time as: Year-day:hour:sec. Convince yourself that this makes sense!
If the antenna is positioned with sufficient view of the sky, the GPS should automatically start “Tracking” and the green LED should light up. If this is not the case after several minutes, check the startup procedure and change it from “automated” to “stationary manual”. The satellites visible to the antenna should be listed in the panel as S and some number (ex. S25).
After the GPS exchanges enough packets with the satellites, the “Locked” LED should light up. This means the GPS is calibrated.
If the Tracking and Locked LEDs are not lit up and has not been recently power-cylced, confirm the status of the GPS device. Check if there is a warning related to the antenna undercurrent. If so, record this in the logbook daily and contact an expert. If after several days the problem has not fixed itself, contact an expert again.
PPS & Splitter
The signal from the GPS is carried to the mini-fieldhubs by 2 lemo cables from ports 7 and 9, meeting at a splitter breadboard. In order to supply each of the 3 mini-fieldhubs with the same GPS & PPS, the signals are split, resulting in output waveforms of approximately 2 volts. Jumpers in the mini-fieldhubs (J4 & J5) have been set to the lowest setting (~1.8 V) to allow for the signal to get properly digitised. From the splitter, the signals are carried on equal length lemo cables to the backs of the mini-fieldhubs.
Thermometer
An individual thermometer is installed to monitor temperatures inside select D-Egg boxes, as well as constantly readout the freezer air temperature. This thermometer (Lutron TM-947SD) has 4 thermocouples and is connected to the PC via a USB port.
Channels: #. R-T-3 (Inside) #. R-T-2 (Inside) #. R-T-1 (Outside) #. Room Temperature
Check that the thermometer is connected via USB and that recent results from the thermometer are reasonable. (You can check the thermometer status by viewing the #chiba-daq slack channel either from your client or the FAT PC).
For more examples, see the next section
Humidity Sensors
Humidity sensors are also installed into the freezer. These are connected via USB to the FAT PC. Check that the cables are connected and verify that the data is reasonable in the same way as the thermometer.
If the data is not reasonable (reading -1 hPa), enter the freezer and unplug/re-plug the monitors. Do this one at a time, not simultaneously.
For more examples, see the next section
Debugging and Diagnosing Problems
This section includes some general use tips for debugging the light system, going through each item. You may have arrived here from automated software prompts or from noticing something looks strange. Any problems you have or fixes you make should be recorded in the logbook.
Optical Fibre
If one or more modules are not seeing a clear signal from the optical fibre, this could typically indicate:
The optical fibre is blocked/dirty. This is usually one of the bottom fibres.
The optical fibre is damaged. This is a very serious situation.
The fibres are very delicate, so treat them very carefully.
If the freezer is above ~10 degrees and not in the middle of an FAT run, entry is permitted. Kill the setup script (domnets) and disable the D-Egg power before entering.
Cleaning the fibre can be achieved using paper wipes and ethyl alcohol. Do not put anything in contact with the fibre output except for the paper wipe. Gently disconnect the fibre from the holder, and carefully wipe across the output several times. Using the compressed air can, blow air through the fibre holder and along the fibre output to dry.
Re-run the test script again (e.x. check_laser_visibility.py).
If the situation does not improve, discuss with an expert.
Function Generator
Function Generator issues may be indicated by:
The laser sync singal is not being produced.
The laser sync signal timing is not as expected (typically 100 Hz).
The check_laser_freq.py script already tries to check for these errors and automatically reboot the function generator from software.
Check that the cable is physically plugged into the function generator and laser.
Consider rebooting the function generator via the physical power switch.
Errors which we attribute to the function generator have been fixed after rebooting.
Laser Supply
Do not touch the laser inside the optical box
Laser issues may be indicated by:
The laser sync singal is not being produced.
The laser sync signal timing is not as expected (typically 100 Hz).
The level of light is lower (or higher) than expected.
First consider checking simple things: if the cable to the function generator is connected, and the output dial is set to the farthest left (for ext input). Although unlikely to change anything, the laser powersupply can also be trivially rebooting by turning the key.
While not impossible, it is highly unlikely that the problems are being caused by a change in the alignment in the optical box. Do not touch any components in the box without talking to an expert.
Tabletop Mainboard
The tabletop mainboard’s issues are typically indicated by:
Communication cannot be established. This should have been found during running
setup.pyA session cannot be started. This could result from the mainboard dying during operation.
If you are having communications issues, disable the setup script, and re-try. In the event that this does not fix the issue, disable the power at the mini-fieldhub and inspect the cable.
If a session cannot be started, the solution is again to re-run setup.py.
This will almost always fix the issue.
If you arrived here due to check_laser_freq.py indicating that the mainboard could not see the laser sync signal, consider debugging the function generator and laser first.
If you have already done so, try running scope.py and look for the obvious sync signal.
This is located in /home/icehap-daq/mcu_dev/src/tools/python/DEggTest.
python3 scope.py --host=localhost --port=10007 --channel=0
Spectral Analyser
An additional tool available for monitoring the conditions in the lab and may be deployed during debugging: a spectral analyser and antenna. The spectral analyser should be connected to power and ethernet to the local network. Upon startup the IP address is reset. Configure the IP address to 10.25.122.241, then run the automated calibration. You may need to verify the data is being collected manually before starting your dedicated debugging session.
Before taking data, mount the blue antenna in your desired location. Connect the SMA cable to the n-type:SMA adapter.