Darknoise measurement
Rationale
Radioactive decays inside the PMT glass and DEgg glass can induce single photoelectrons. This measurements aims to characterize this darknoise, including the charge distribution, darknoise rate as function of trigger threshold and deadtime after pulses. Additionally, the dt distribution of darknoise hits is recorded.
The DAQ strategy is to record very long waveforms, then pick the region around pulses that exceed a software trigger threshold. These are stored on disk and analyzed lateron.
This measurement is done at approximately -30C to simulate the behavior in the ice as closest as possible.
Setup
Since noise rates of PMT are highly dependent on temperature and prior illumniation levels, we need to make the measurement in a cooler. The cooler used for this is shown in Fig. 29.
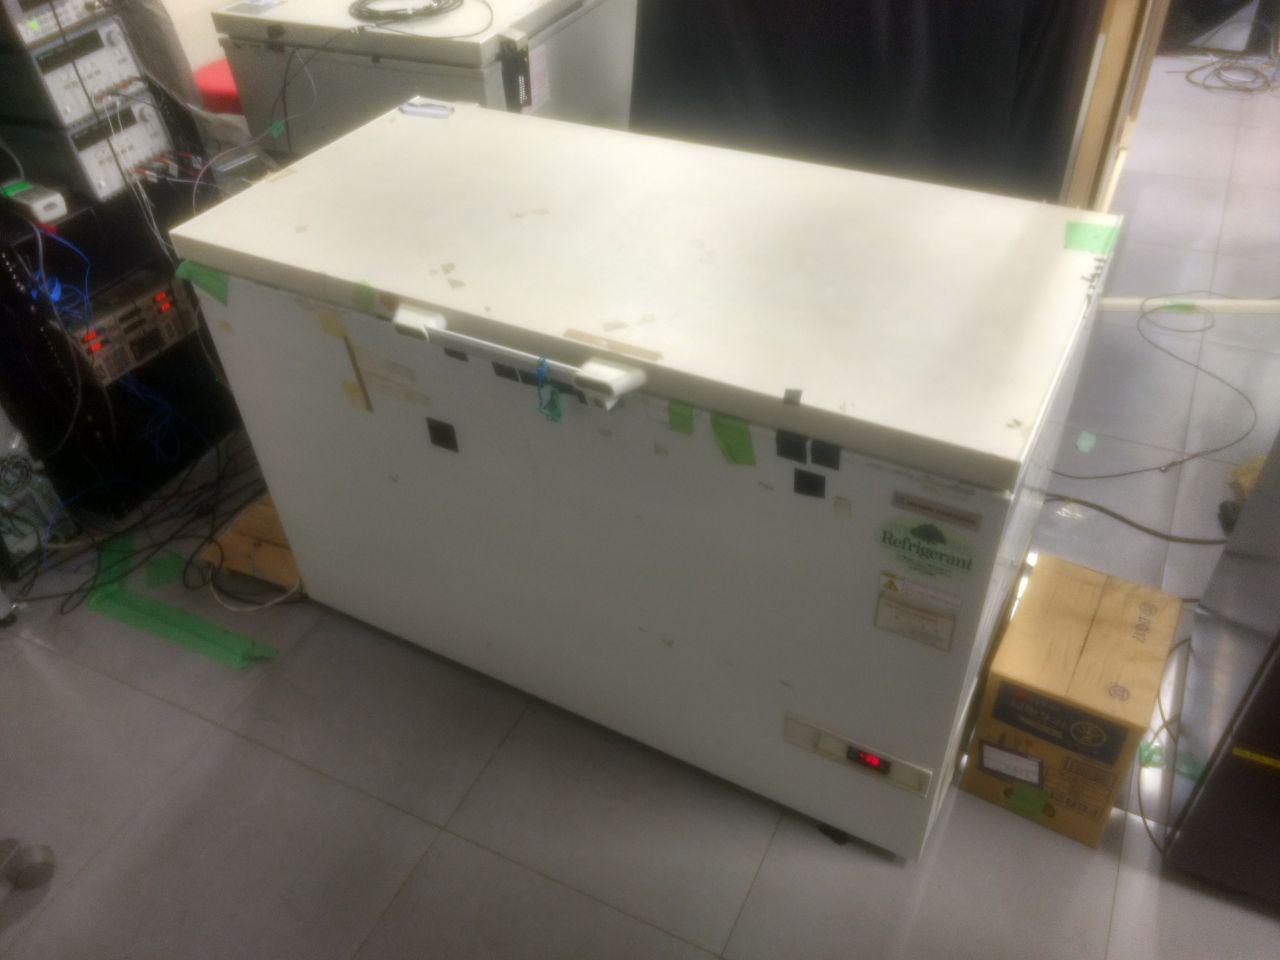
Fig. 29 The freezer for the darknoise measurements
Since reflections at the DEgg glass-air surface will not be present in the ice, because the refractive indices of glass and ice are very similar, the photocathode area has be be covered with black tape. A PMT prepared in this way is shown in Fig. 30.
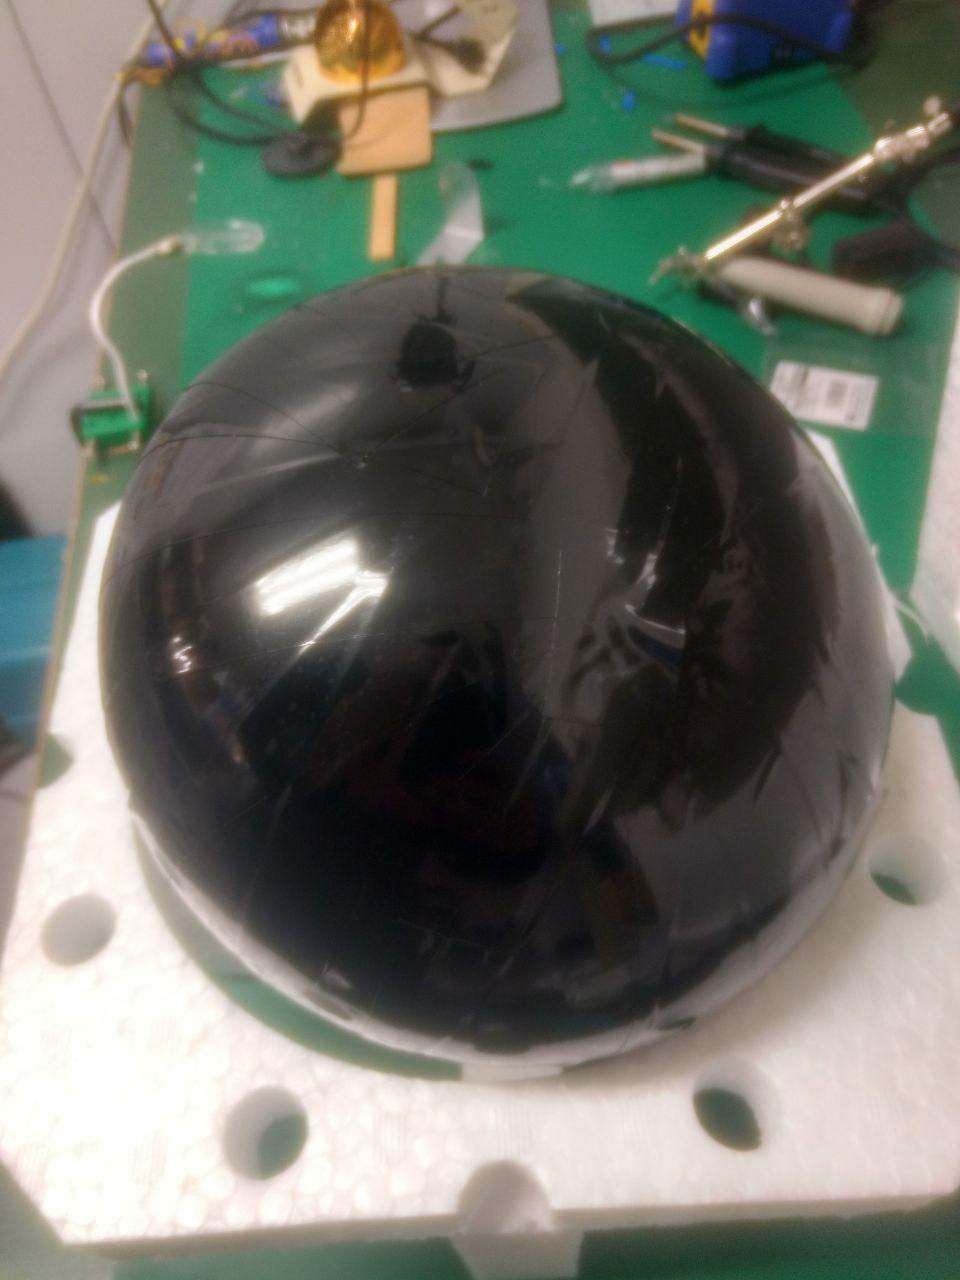
Fig. 30 A PMT covered with black tape
The PMT is then placed in the cooler, and a temperature probe is fixed to the middle of the photocathode area. Power and signal cabling is attached to the HV board. The PMT is then covered with black tarps. After closing the freezer, the temperature should be set to ~-34C to ensure an actual temperature of -30C. This can be monitored be the handheld readout of the temperature sensor shown in Fig. 31.
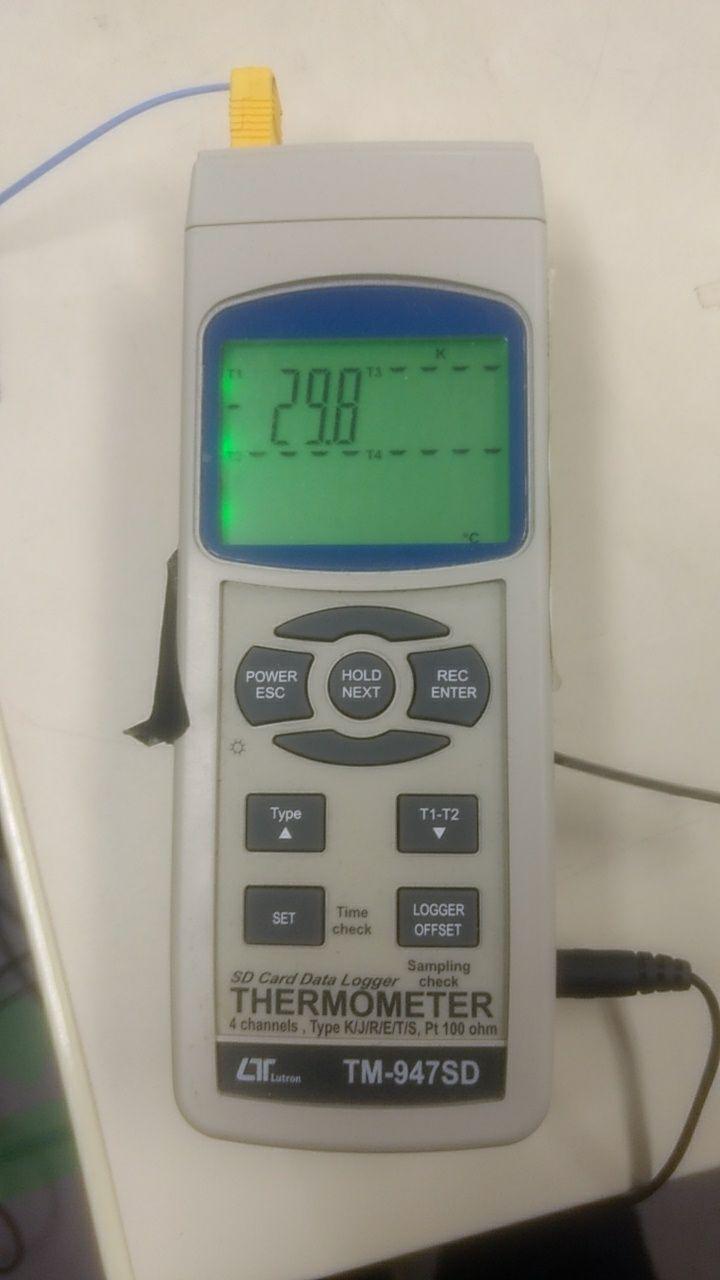
Fig. 31 Handheld temperature sensor
Finally, the freezer is covered with a thick black cloth. Make sure, that the radiator at the back of the freezer is not covered, and set a paper box in front of the exhaust on the lower right side of the freezer, so that it can cool down properly.
The readout for this measurement is done by the Tectronix oscilloscope in the
rack next to ratafia. The settings for the oscilloscope are listed in Ayumis
sheet.
Wait until the temperature inside the freezer is stable at -30C, but wait at least 15h!
Running the DAQ
Unlike all other measurements here, the data is taken by scotch, the PC at the far side of the lab. You can ssh there from ratafia with a remote jupyter session. Use this custom command for that (the password is the long standard one):
ssh_scotch
The data acquisition is controlled by a jupyter notebook stored in:
/home/skua/measurements/daq/notebooks/darkrate_meas_scotch.ipynb
It records very long waveforms, then picks out regions, where a software trigger picked up pulses. It then stored these regions on disk.
Analysis
After the measurement is done, you need to transfer the data to ratafia, use this command for that, replacing {pmt_name} with the PMTs serial number:
rsync -ruv --ignore_existing /home/skua/measurements/daw/data/darkrates/{pmt_name} icecube@10.25.123.120:/home/icecube/measurements/daq/data/darkrates/{pmt_name}
An overview of all commands to run for the analysis for these data is stored on ratafia in:
/home/icecube/measurements/analysis/workspace/darkrates/README
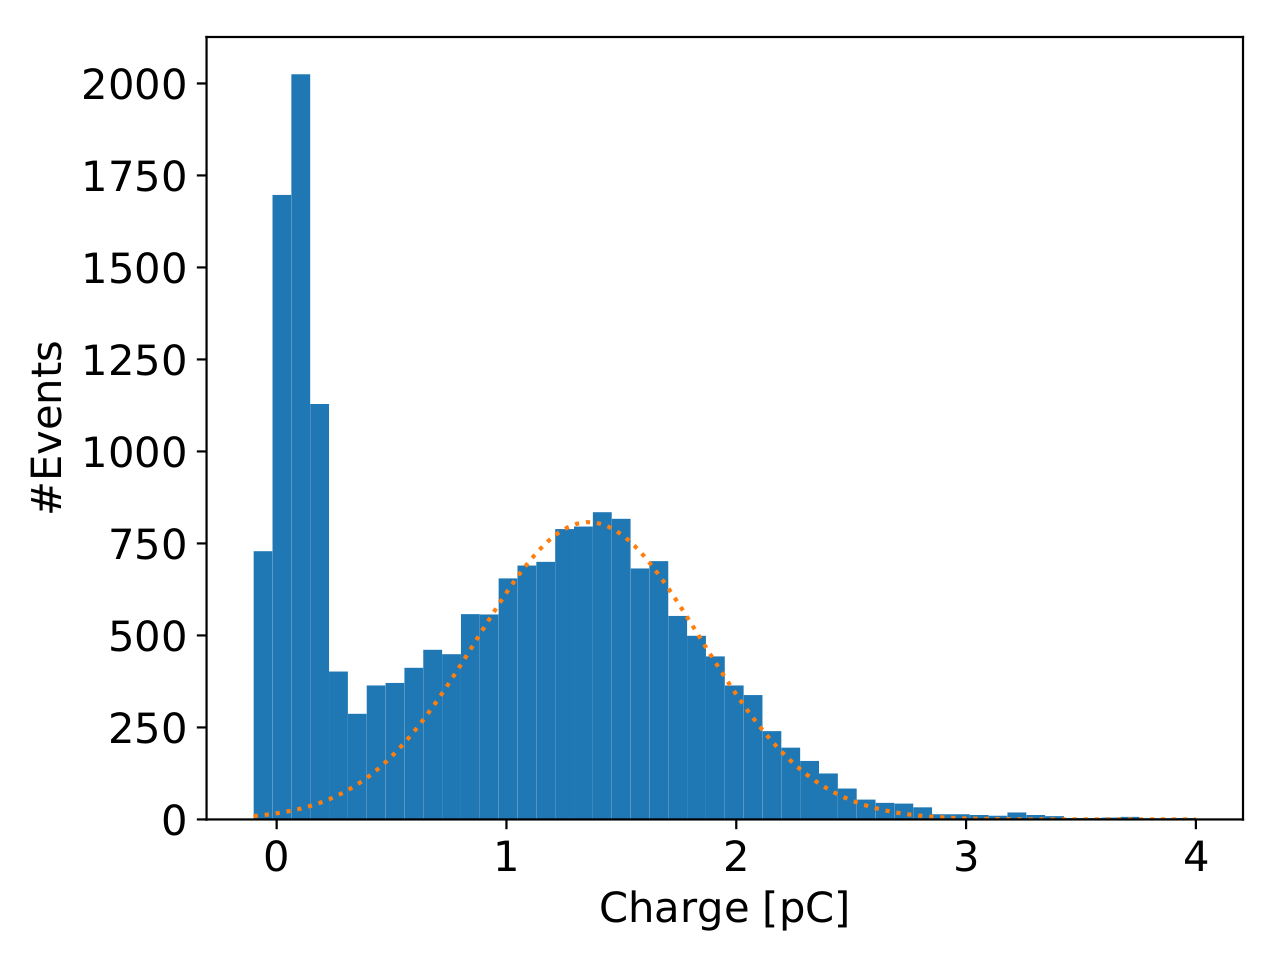
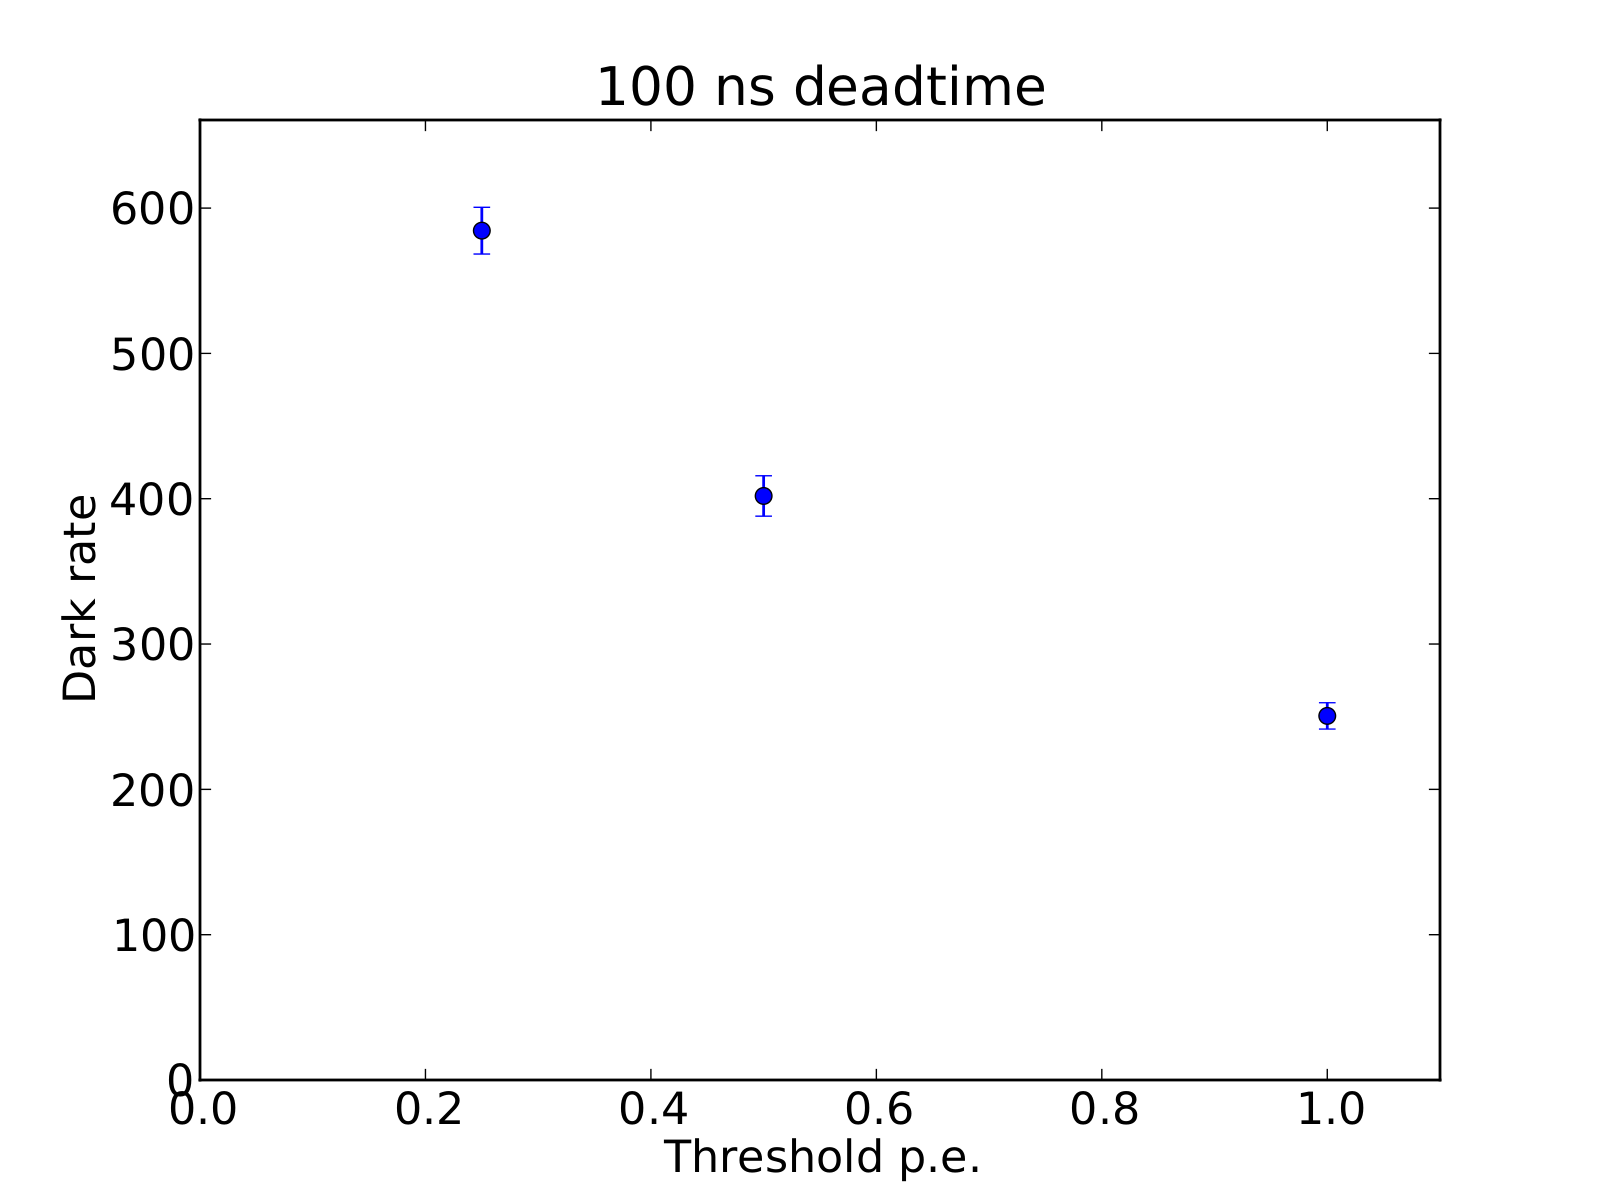
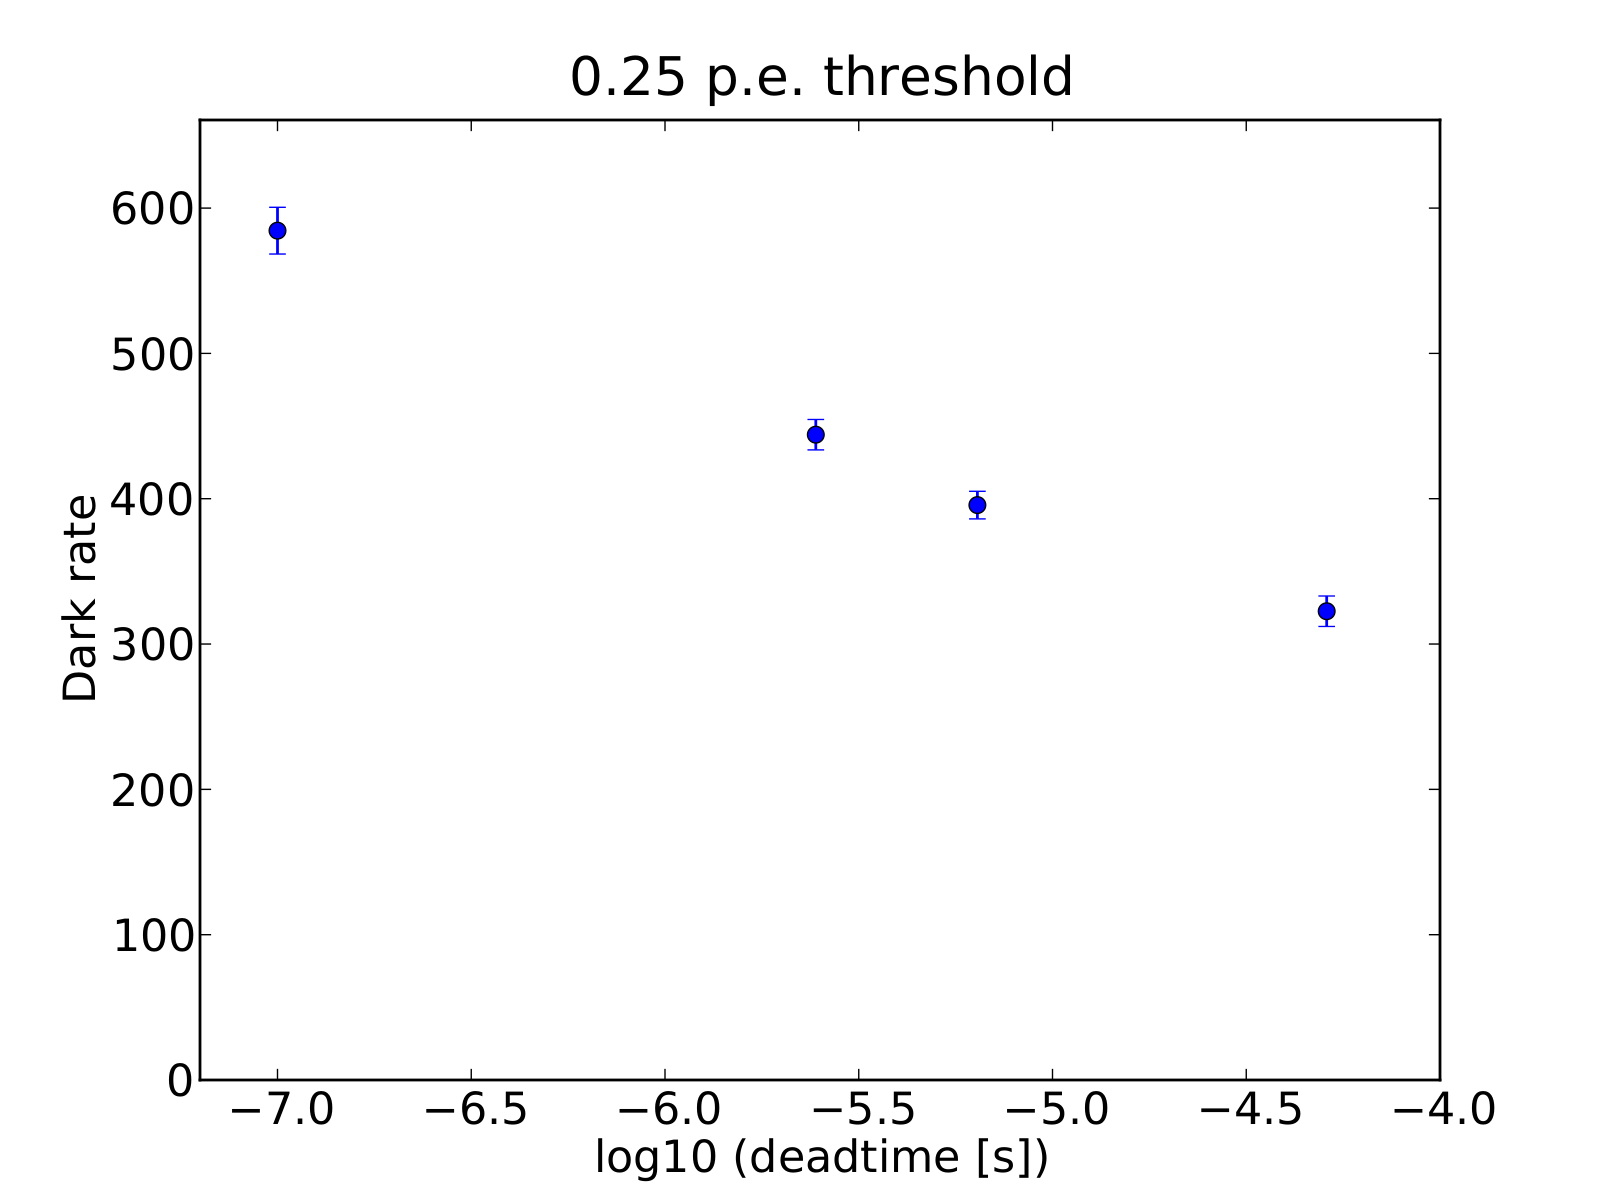
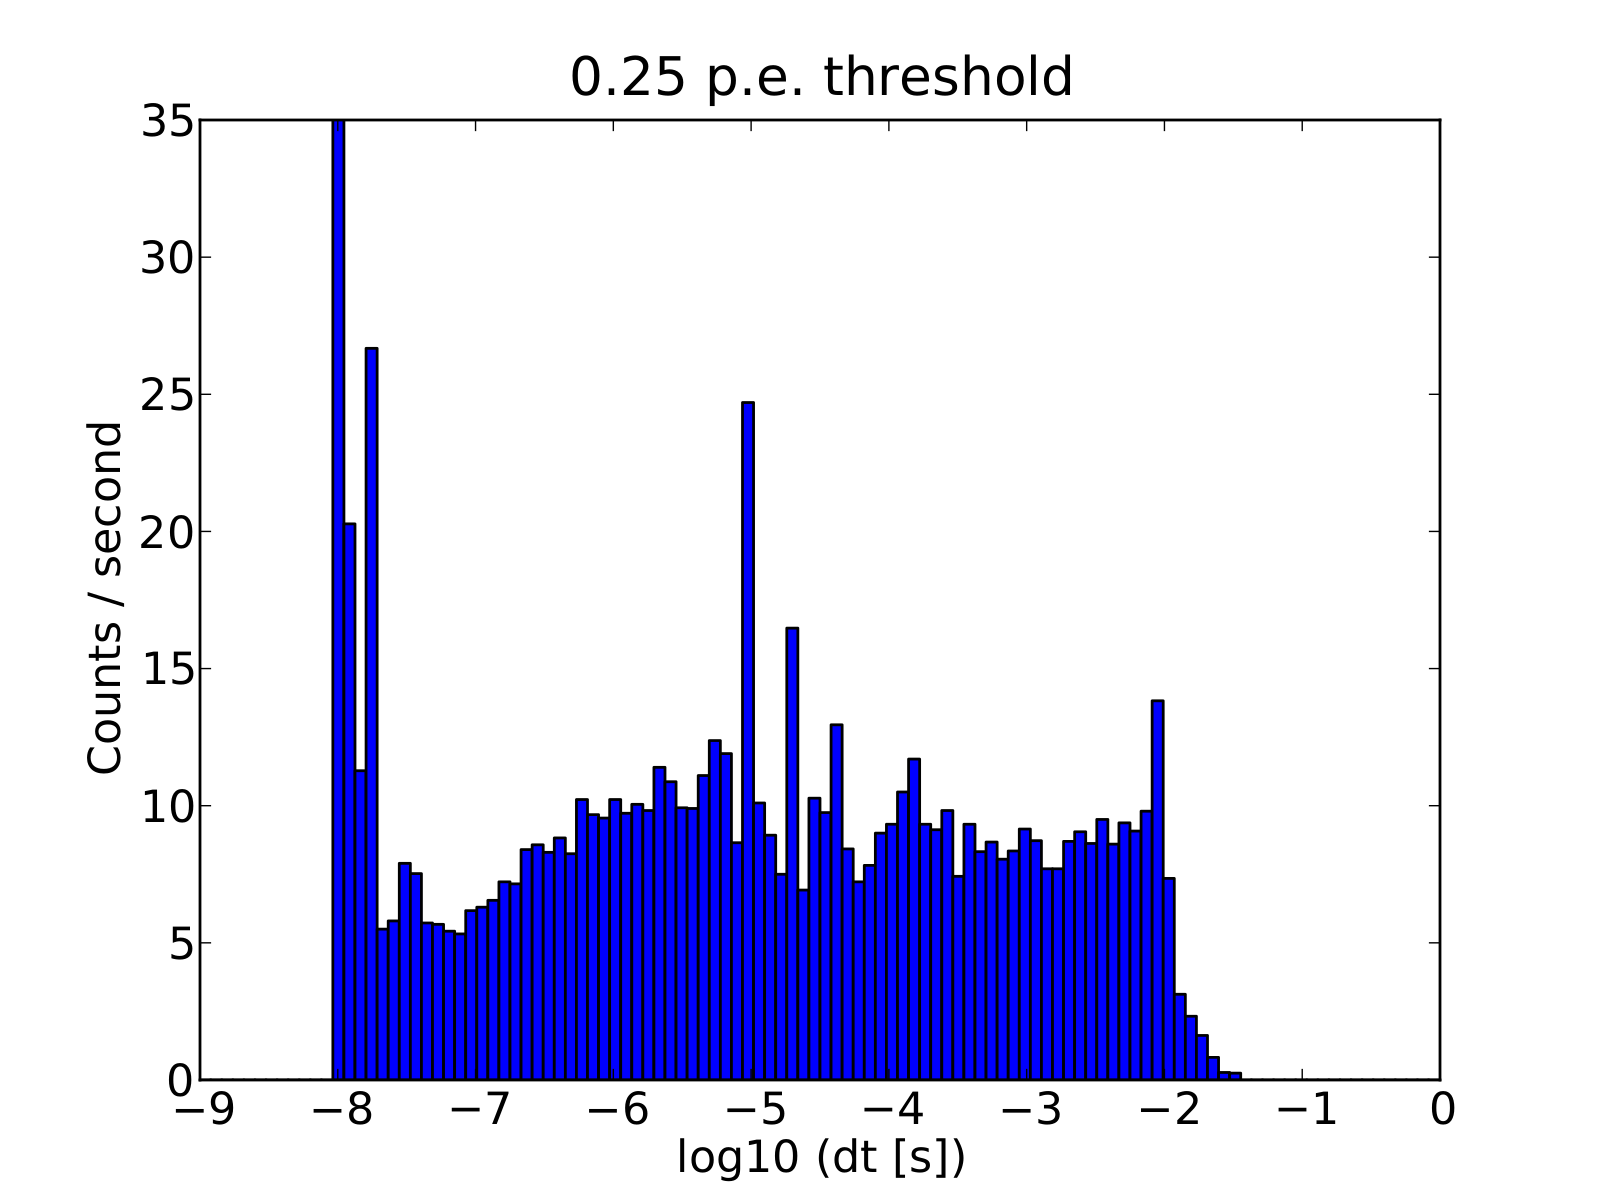
Firstly, a charge distribution is made. Then, a shell script will be created, that contains all other necessary commands. That script is executed, and plots will be stored on disk. Down below are some example plots.
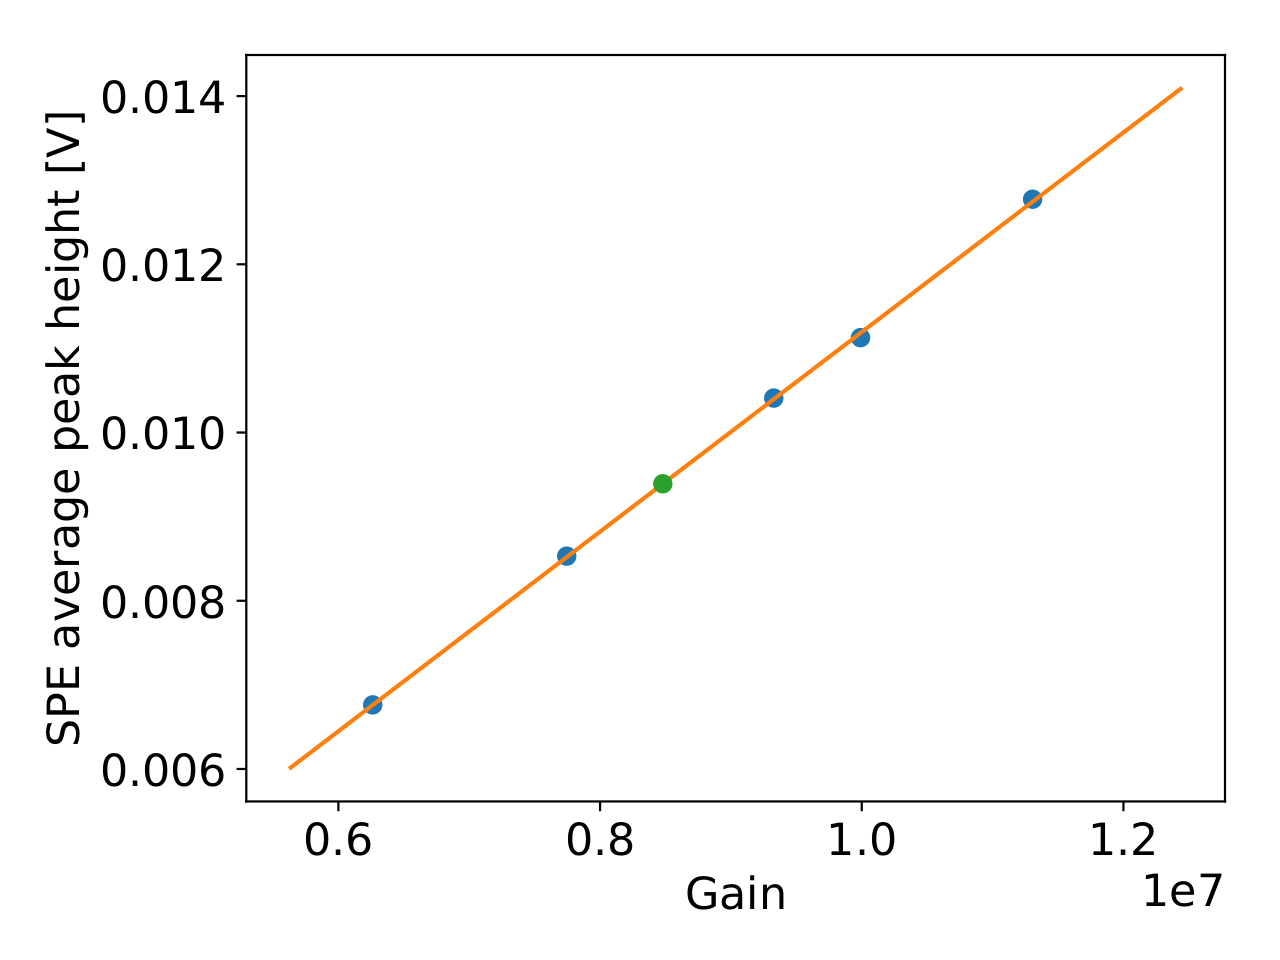
The plots include the charge histogram, the darkrate as a function of software trigger threshold in units of average SPE peak height. The darkrate as a function of deadtime after each pulse, a dt histogram between neighbor pulses, and a correlation plot between gain and SPE peak height.
