![]()
Contents:
Block diagram for QE measurement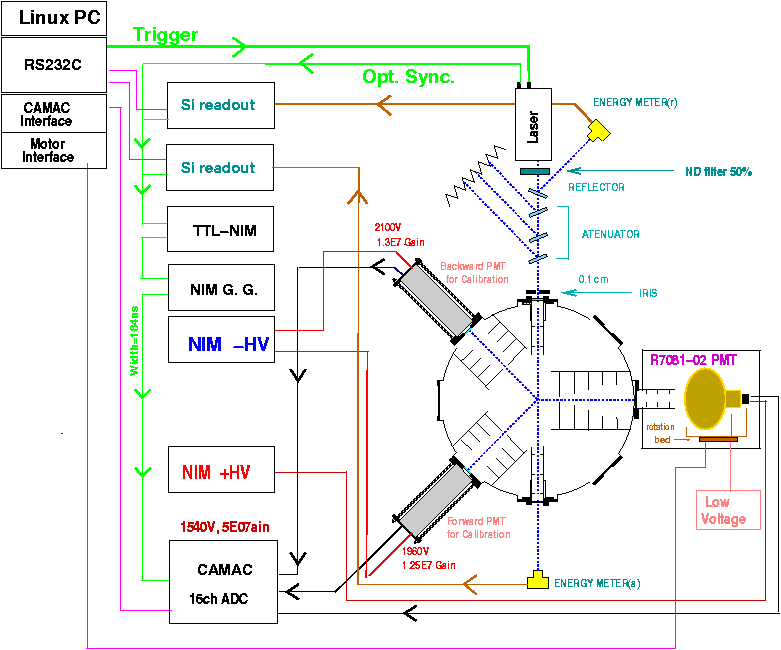 |
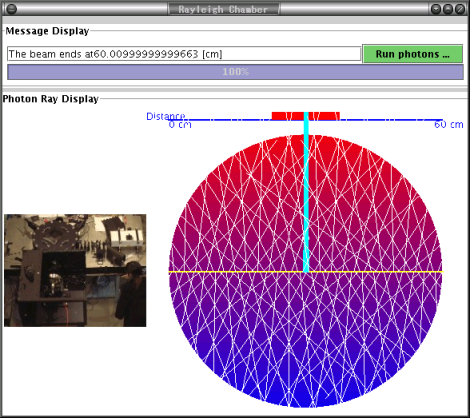
Actual picture of QE measurement system 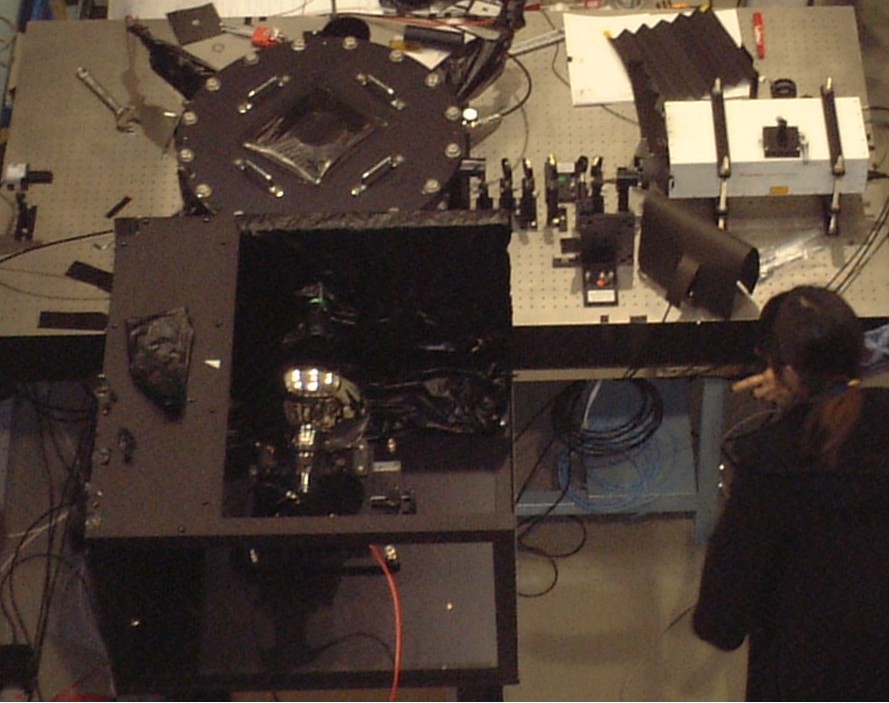 |
| photoelectron # = -ln(Nped / Nall) |
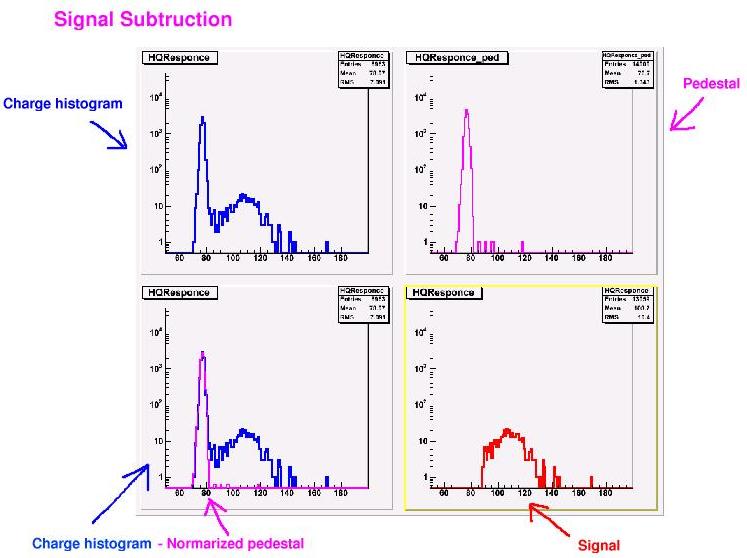
|
|
|
|
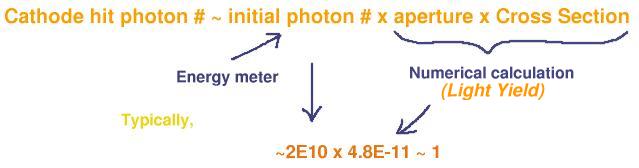
QE (absolute efficiency) = photoelectron # / cathode hit photon # |
SF0077@1atm |
|
SF0077@1atm (After the removal of the first 6,000 and out of one sigma range events)  |
around the photocathode center |
around 15[cm] from the photocathode center |
| SF0050 |
| DATA FILE | QE[%] | ERROR | Distance from the photocathode center[cm] |
| y2004m09d17p10.dat | 20.0325 | 0.0868392 | 0 |
| y2004m09d20p01.dat | 17.7593 | 0.121936 | 0 |
| y2004m09d20p02.dat | 18.5892 | 0.0945743 | 5.93 |
| y2004m09d20p03.dat | 16.8919 | 0.0958374 | 11.8 |
| y2004m09d20p04.dat | 1.20274 | 0.196149 | 15.4 |
| y2004m09d20p05.dat | 17.6576 | 0.116309 | 0 |
| y2004m09d20p06.dat | 19.5398 | 0.0920839 | -5.93 |
| y2004m09d20p07.dat | 14.8435 | 0.0972703 | -11.8 |
| y2004m09d20p08.dat | 1.92133 | 0.156101 | -15.4 |
| y2004m09d20p09.dat | 17.9424 | 0.0947305 | 0 |
| SF0061 |
| DATA FILE | QE[%] | ERROR | Distance from the photocathode center[cm] |
| y2004m09d21p05.dat | 21.1387 | 0.0999389 | 0 |
| y2004m09d21p06.dat | 19.3256 | 0.0979788 | 5.93 |
| y2004m09d21p07.dat | 17.0326 | 0.0969918 | 11.8 |
| y2004m09d21p08.dat | 2.24462 | 0.173178 | 15.4 |
| y2004m09d21p09.dat | 19.2871 | 0.12382 | 0 |
| y2004m09d22p10.dat | 18.6451 | 0.0968707 | -5.93 |
| y2004m09d22p03.dat | 13.8617 | 0.102839 | -11.8 |
| y2004m09d23p04.dat | 1.92609 | 0.174631 | -15.4 |
| y2004m09d23p06.dat | 21.0964 | 0.11911 | 0 |
| SF0077 |
| DATA FILE | QE[%] | ERROR | Distance from the photocathode center[cm] |
| y2004m09d22p07.dat | 17.9147 | 0.126516 | 0 |
| y2004m09d22p08.dat | 22.3986 | 0.0907867 | 5.93 |
| y2004m09d22p09.dat | 16.0187 | 0.0959121 | 11.8 |
| y2004m09d22p10.dat | 4.30367 | 0.143454 | 15.4 |
| y2004m09d22p12.dat | 24.7156 | 0.112449 | 0 |
| y2004m09d22p13.dat | 22.5529 | 0.122015 | 0 |
| y2004m09d22p14.dat | 20.3068 | 0.0942222 | -5.93 |
| y2004m09d22p16.dat | 19.1821 | 0.0955467 | -11.8 |
| y2004m09d23p03.dat | 3.07845 | 0.156723 | -15.4 |
| y2004m09d23p04.dat | 21.8818 | 0.118928 | 0 |
SF0050@1atm
SF0061@1atm
SF0077@1atm |
SF0061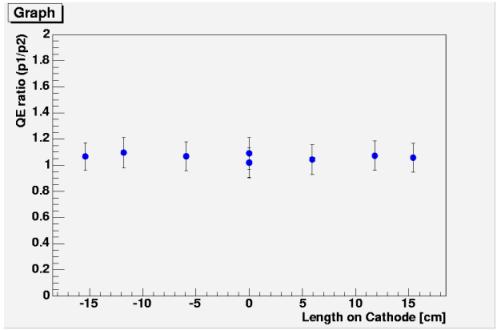
|
SF0050@1atm, center |
SF0061@1atm, center |
SF0077@1atm, center |
SF0077@0.3-1.0[atm], center
|