IceCube/PMTs


Absolute Calibration using
Rayleigh scattering in pure N2 air

We are measuring absolute efficiency (QE x CE) of the PMT using the Rayleigh scattering of photons (337.1 nm, N2 laser) in the vacuum chamber filled with pure N2 air. Because the cross section of the Rayleigh scattering is well understood, We can estimate the number of photons scattered and entering the photocathode by measuring initial photons numbers with the laser energy meter.

Contents:


Motivation

Our main motivations of this measurement are here: HAMAMATSU has already provided typical absolute quantum efficiency. -> HAMAMATSU data (pdf, 205kb)
But, HAMAMATSU measurement is the DC light source measurement and it would be nicer to perform absolute calibration by pulsed AC light source we are actually supposed to detect. Also, having independent capability of absolute calibration measurement is necessary so that we are able to make our own data base of absolute efficiencies to enhance data analysis accuracy.

What you need for Absolute Calibration?

Light should be dark enough for some redundancies, to make us save trouble of the gain calibration, for example.
Then, we use the Rayleigh scattering mechanism for beam dump.
The initial photon number from pulsed laser is 10^10, we can dump it to less than 1.


top


Measurement Setup (Click each figure for large ones)

We use N2 laser (Laser Science VSL-337ND-S), the wave length of the shot is 337.1 nm.
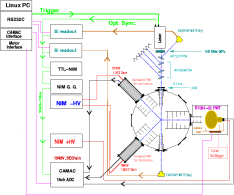
Each parameters are monitored as bellow:
Block diagram for QE measurement
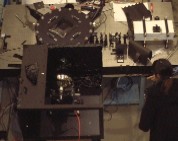
Actual picture of QE
measurement system
top


Data Analysis

I. Estimate the photoelectron #.
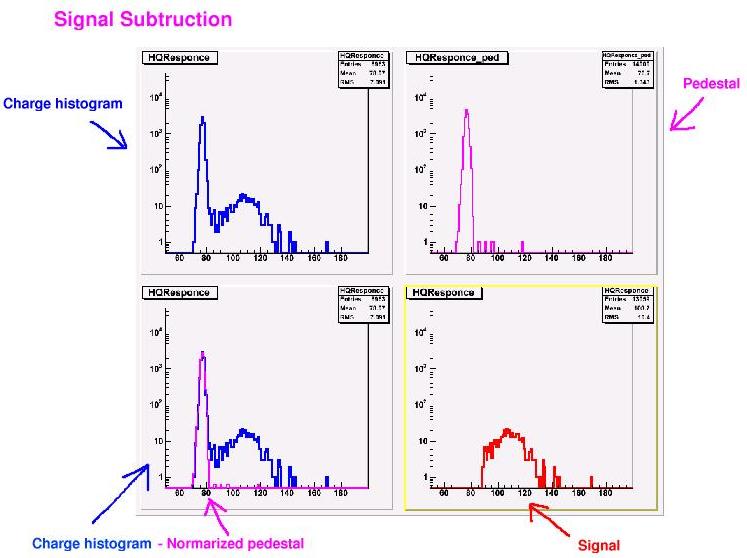
Supposing Poissonian for the distribution of the charge response, photoelectron number can be described with the number of pedestal events and the all the event as bellow.

photoelectron # = -ln(Nped / Nall)

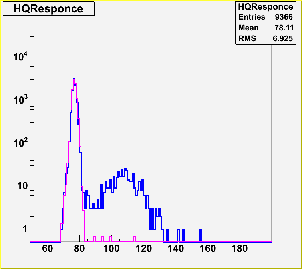
Here is the charge histogram data. See upside two histograms, left one is the charge histogram data and the right is pedestal data. We get the pedestal data every 100 ns between taking the signal data. Subtract the normalized pedestal events from all the events and estimate the number of signal events, then, we can estimate the number of pedestal events.


II. Estimate the incidental(cathode hit) photon #.


Light yield

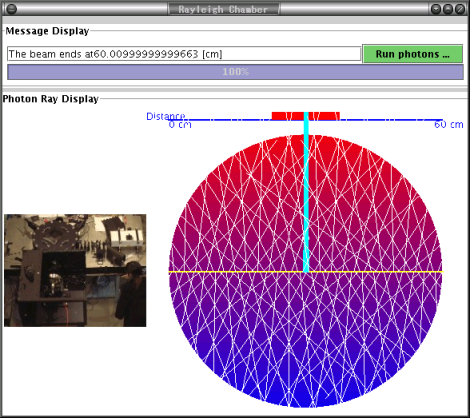
We estimate the scattered light yield with the numerical calculation written in Java (the panel bellow).
The light from the laser comes from the left side in the figure bellow, scattered by N2 air filled in the chamber (the circle) as it goes through. And the scattered light can come toward the target PMT cathode only from the vertical way to the cathode because of the limitation of the baffle, and most of the light go through the chamber straight into the energy meter placed outside of the chamber (the right side in the figure).


Then,

QE (absolute efficiency)
= photoelectron # / cathode hit photon #

Event Cut (For more accracy...)

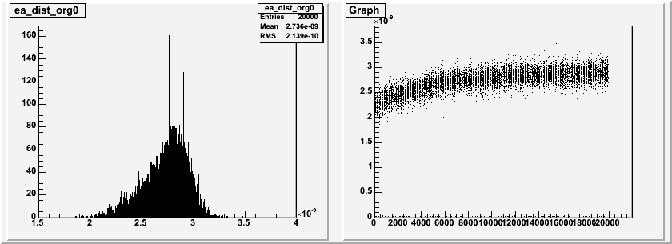
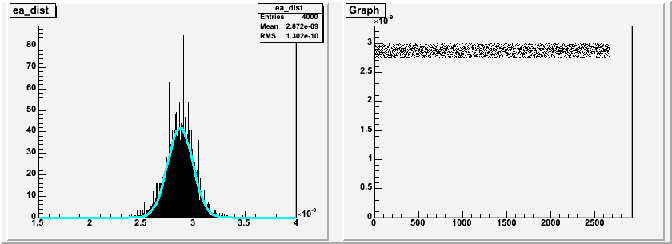
Here are the distribution of initial photon number.
Right one shows the number of photons as a function of time, the horizontal axis is the event number,run begins from 0 to the end.
Time scale of between 0 and the end is one and a half hour.
Left one is the projection of it. Horizontal axis is the absolute energy of initial photon and the vertical is the counts. Each points corresponds to each event. You can see the energy of laser shot rise to up as the time passes by, and then come to be stable. This can be seen the non-Gaussian tail in the projection (left panel).
So, we remove the first 6,000 events of the data, and for more accuracy, the events out of the one sigma range also removed.

SF0077@1atm


SF0077@1atm
(After the removal of the first 6,000 and out of one sigma range events)
top


Results (Click each figure for large ones)

Center and egde (Click each figure for large ones)

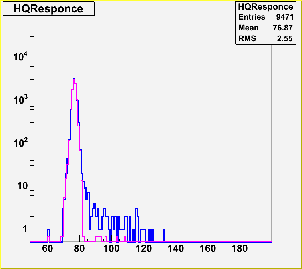
Here's the charge spectrum of center and edge of the photocathode. The data has very clear peak to valley around the center of photocathode, in contrast around the edge of photocathode.

around the photocathode center
around 15[cm] from the photocathode center


Summary of QE calculation

Position dependence pf absolute efficiency (Click each figure for large ones)

Using single p.e. events for this measurement. Spot size of the scattered light source, estimated approximately same as the diameter of the closest baffle to the photocathode, is 1.3 cm. Each "step #" parameter (unit of the stepping motor which drives rotation bed for the PMT positioning);
0,5000,10000,13000,15000 can be replaced with the distance on the photocathode from its center[cm];
0(center), 5.93, 11.80, 15.40, 17.83 (apparent edge of photocathode)[cm] (:actual measurement value)


SF0050
DATA FILE QE[%] ERROR Distance from the photocathode center[cm]
y2004m09d17p10.dat 20.0325 0.0868392 0
y2004m09d20p01.dat 17.7593 0.121936 0
y2004m09d20p02.dat 18.5892 0.0945743 5.93
y2004m09d20p03.dat 16.8919 0.0958374 11.8
y2004m09d20p04.dat 1.20274 0.196149 15.4
y2004m09d20p05.dat 17.6576 0.116309 0
y2004m09d20p06.dat 19.5398 0.0920839 -5.93
y2004m09d20p07.dat 14.8435 0.0972703 -11.8
y2004m09d20p08.dat 1.92133 0.156101 -15.4
y2004m09d20p09.dat 17.9424 0.0947305 0
SF0061
DATA FILE QE[%] ERROR Distance from the photocathode center[cm]
y2004m09d21p05.dat 21.1387 0.0999389 0
y2004m09d21p06.dat 19.3256 0.0979788 5.93
y2004m09d21p07.dat 17.0326 0.0969918 11.8
y2004m09d21p08.dat 2.24462 0.173178 15.4
y2004m09d21p09.dat 19.2871 0.12382 0
y2004m09d22p10.dat 18.6451 0.0968707 -5.93
y2004m09d22p03.dat 13.8617 0.102839 -11.8
y2004m09d23p04.dat 1.92609 0.174631 -15.4
y2004m09d23p06.dat 21.0964 0.11911 0
SF0077
DATA FILE QE[%] ERROR Distance from the photocathode center[cm]
y2004m09d22p07.dat 17.9147 0.126516 0
y2004m09d22p08.dat 22.3986 0.0907867 5.93
y2004m09d22p09.dat 16.0187 0.0959121 11.8
y2004m09d22p10.dat 4.30367 0.143454 15.4
y2004m09d22p12.dat 24.7156 0.112449 0
y2004m09d22p13.dat 22.5529 0.122015 0
y2004m09d22p14.dat 20.3068 0.0942222 -5.93
y2004m09d22p16.dat 19.1821 0.0955467 -11.8
y2004m09d23p03.dat 3.07845 0.156723 -15.4
y2004m09d23p04.dat 21.8818 0.118928 0


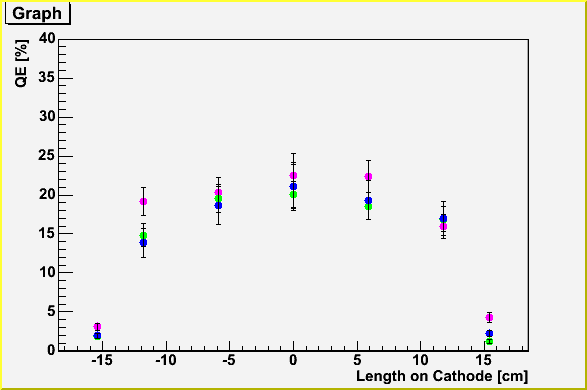
Here is the plot of the data above. Horizontal axis is the length on cathode. 0 corresponds to the center of the photocathode, while the edge does about 15 cm off from the center. You can see the efficiency doesn't change so much around center and the asymmetry of efficiency distribution. There's almost no efficiency outside area at more than 15 cm from the center.
The data of these three PMTs look like similar distribution, but trend of individual tubes starts to appear.
SF0050@1atm SF0061@1atm SF0077@1atm

top


Verification

Now, here we discuss the confidence level of the present results.

Check air condition(Rayleigh dominant)
by forward and backward monitor PMT

First, we should confirm that our measurement condition is truly Rayleigh dominant.
The answer is 'yes'.
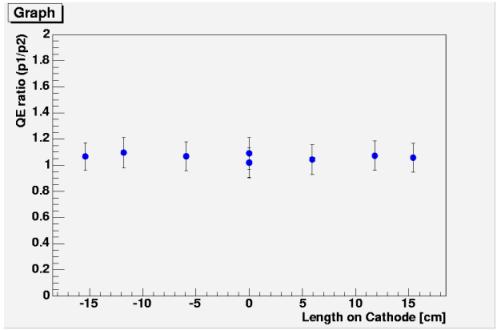
Here's the data of ration of efficiency of forward and backward monitor PMTs.
Horizontal axis is the length of photocathode. If it's Rayleigh dominant, the ration should be 1. You can see the ratio is constant and approximately 1 and stable.
Small offsets of each points are because of the difference of the monitor PMTs efficiency.
Plots include cases of other PMTs measurement are here (Magenta corresponds to PMT SF0077 and Green to SF0050).
SF0061


top

Time dependence(stability check)

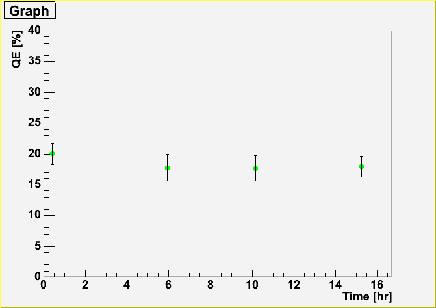
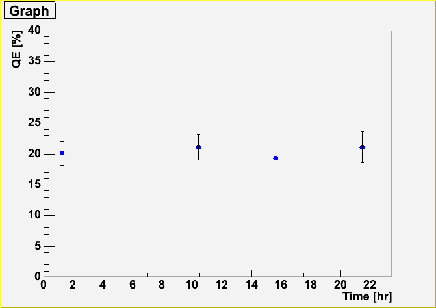
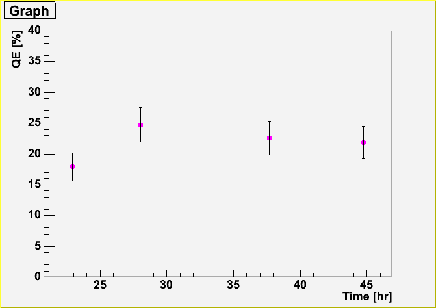
We repeat the same measurement from time to time to see how robust our numbers are.
The horizontal axis is the passed time since pressure of inside the chamber has been set to 1 atm with pure nitrogen air. And vertical shows the absolute efficiency of the IceCube PMT.
You can see that efficiency numbers we obtained are quite stable around 18% no matter when we make measurements.
SF0050@1atm, center
SF0061@1atm, center
SF0077@1atm, center
top

Pressure dependence(no offset)

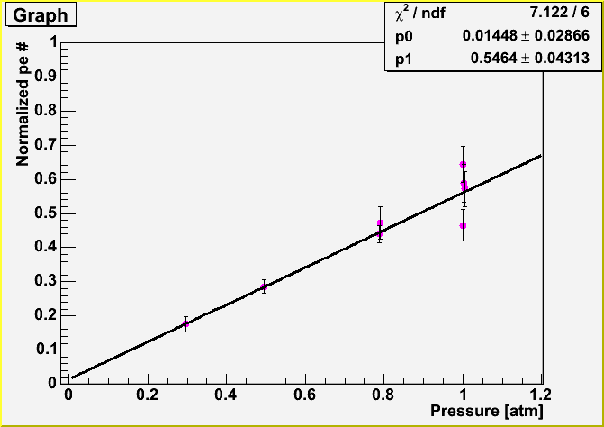
We also took the data with all the same procedure but only the pressure of inside the chamber changed from 0.3 atm to 1 atm to see there's no offset for our data and it depends on only the number of targets.
You can see the y-offset is quite close to 0 in this plot, which shows there's no offset for our measurement.
SF0077@0.3-1.0[atm], center


top


Typical Error Budget (Click each figure for large ones)

Here's the error budget summary. Statistical error is still dominant, level of 10% because it was time consuming job to accumulate signals under really dim light source environment. Main systematic uncertainty arises from fluctuations of laser luminosity from shot to shot and also from limited accuracy of energy probe to evaluate initial number of photons emitted from the laser. In the present analysis, total error including systematic uncertainties is about 12 to 13 %.
top


Summary

We summarize the result of this measurement:
top


mailto:miya@hepburn.s.chiba-u.ac.jp
Last modified: Thu Jan 13 23:28:56 JST 2005