Implementation of results from the Golden PMT/DOM measurement to the IceCube simulation
back to Golden PMT page
Implementation of results from the Golden PMT/DOM measurement to the IceCube simulation
Abstract
This page describes the use of GDOM calibration data in the "ROMEO", a package to simulate photon propagation through the DOM's GLASS/GEL and associated PMT responses.
We have a limited number of measured points in the actual Golden DOM calibration (in beam incident directions and
wavelength).
This requires us to study a way to interpolate/extrapolate these data points in order to simulate behaviors of photon other than the one measured.
The photon propagation in the glass and gel has been independently simulated by the GEANT4 and the results are stored in the table form. ROMEO reads the table
and simulates PMT responses. We consider that this part of the ROMEO simulation (or the uncertainties in the optical characteristics of gel) could be a source
of partial disagreement between the ROMEO and the DOM calibration data.The study shows that a small wavelength shift results a good agreement.To define whether such a small correction is really effective or not, we compared the photo-electron number
generated by two cases, ROMEO without correction and ROMEO with a slight shift.
And it was shown that there was little difference between these.
As a result,ROMEO and DOM data agrees without any correction.
Contents
1. Golden PMT/DOM Data
2. Functions used int the simulation
3. Analysis method
4. Results
5. Summary
The available data sets from the GOLDEN PMT/DOM calibration are following:
The first three data sets are obtained from the relative calibration.
The latter two are from our absolute calibration.
The year 2005 and 2006 absolute data sets are obtained in different
combinations of wavelengths because of the difference in the methods to do the absolute calibration:
| year |
PMT |
DOM |
| 2005 |
337nm |
337nm |
| 2006 |
337nm |
365nm,470nm,520nm,572nm |
[About 2005 PMT QE]
The 2005 Golden PMTs have a trend that the QE measured by Chiba appears approximately 15% higher
than that indpendently measured by HAMAMATSU using the DC light source.
We used Hamamatsu measurement for 2005 PMT QE instead of Chiba . We will talk this issue more later.
*For details of GPMT/DOM Experiment, see->GPMT/DOM Experiment
*For details of GPMT/DOM calibration Results, see->GPMT/DOM Results
Fig1 shows the transmission of the photon in GLASS/GEL.
The transmission is shown as a function of the incident photon's wavelength.
Blue line is the Elisa's measurement which was done many years ago using just one old gel sample.
On the other hand, red line is derived from the current measurement done at Madison using many samples.
As you see,the transmission of the Madison is nearly 1 above 400 nm, while one of Elisa is about 0.8.
ROMEO uses red line because the latest Madison's results are supposed to represent the glass and gel that are already implemented at the south pole.
Fig2 is the averaged charge response function.
The red line is the averaged data of 118 PMTs over three years measured by Chiba group.
The dotted line is default value used in ROMEO before.
Now parameters of red line are used in the latest ROMEO.
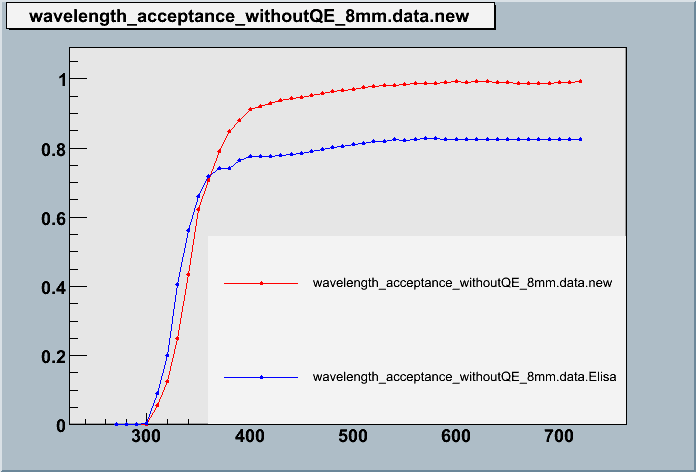
Fig1. Transmission of glass and gel
| 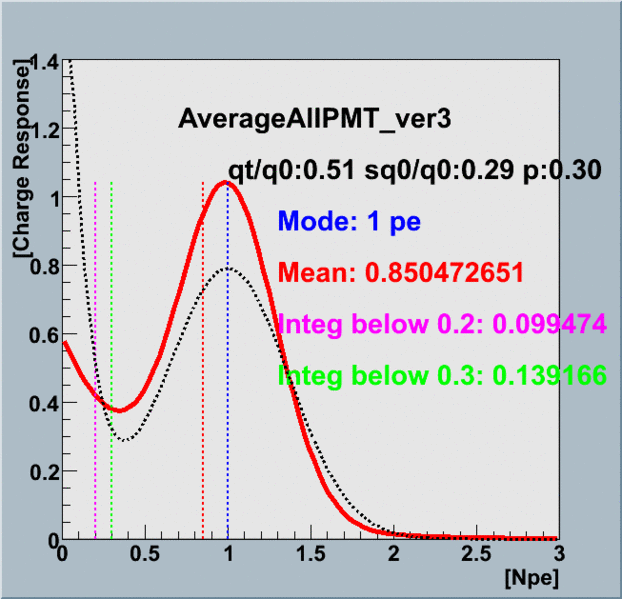
Fig2.Averaged charge response
|
*Data Summary , see->Data Summary
*For details of average Charge Response, see->Charge Response Analysis
*For details of PMT/DOM 2D sensitivity, see->PMT/DOM 2D sensitivity
We consider that the differences in the ROMEO simulation and the DOM data
arise from our incomplete knowledges of the glass and gel transparency.
Look at the Fig1 again.
It shows that the sharp fall-off of the transmission
starts at around 350 nm.
This indicates that a sizable change of the transparency can be introduced by even a tiny shift of wavelength and this effect makes the more systematic
inconsistency between the simulation and the data in the short wavelength region.
In this study, we evaluate values of the wavelength shift in the glass+gel transmittance data such that ROMEO simulation reasonably describes the DOM calibration data.
Here, we search for the value of the wavelength shift to give the best agreement
between ROMEO and the data for 337 nm wavelength.
Then the agreement at the other wavelengths by the same correction recipe is evaluated.
This analysis is carried out by running ROMEO with the special configuration following the LED light profile
at the Chiba's DOM calibration.
The comparison between the simulation and the data
are made by looking the difference of the simulated and measured detection efficiencies
at various locations on the DOM sphere surface.
This is the results of the averaged data.
PMT QE calculated for overall PMT cathode is put into the ROMEO and we tried two ways of this calculation.
One is the case of using the averaged 2D uniformity and charge response of just GoldenPMTs, what we call "TA0002".
Another is using averaged data of 100 PMTs, what we call "TA0003".
For this study we should calibrate ROMEO with "TA0002", however we should put into ROMEO "TA0003" actually which more general one.
The difference of PMT QE between "TA0002" and "TA0003" was about 3%.
In this page we show the results of using "TA0003" only.
See more information ->Data Summary
Wavelength dependence of QExCE
Fig3 shows the wavelength dependence of the QExCE.
Red points are the QExCE measured by Chiba group , the green histogram is the expected efficiency derived from the ROMEO simulation without correction of the wavelength shift and blue one is derived from ROMEO with 4.48nm shift of the transmission curve described before.
This is the case for the QE which is measured or simulated at the DOM center.
ROMEO used Hamamatsu QE curve to predict the wavelength dependence of the QE.
The systematic error of the measured DOM QE data is about 8%.
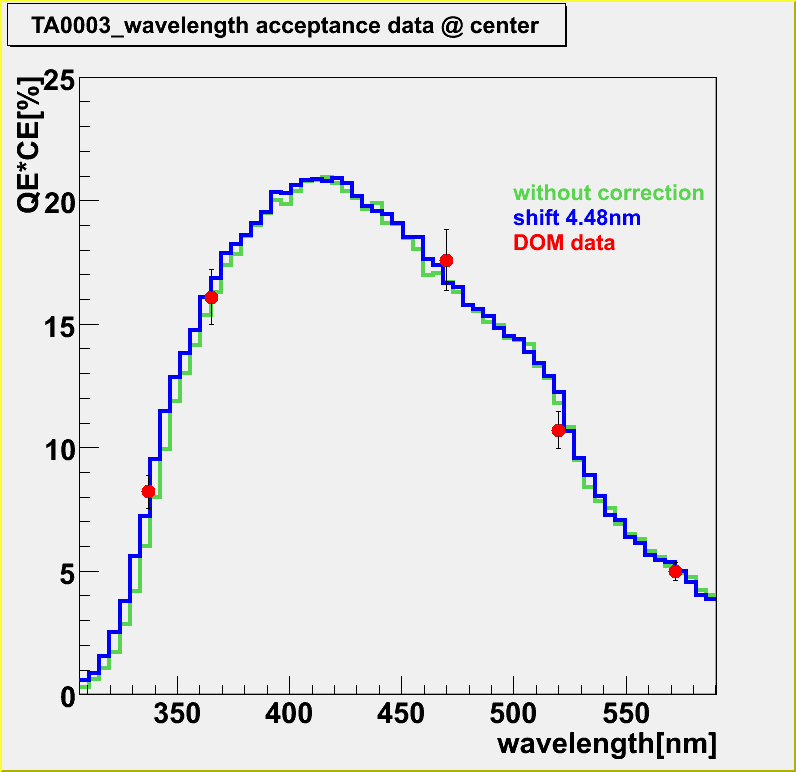
Fig3.Wavelength dependence of QExCE
|
By the way, we tried to use Chiba measurement for 2005 PMT QE.The result is showm in Fig4.
Green histogram is the case of using Hamamatsu QE for 2005 PMT and blue one is the case of using Chiba QE for 2005 PMT.
You may see that Hamamatsu data shows better agreement than Chiba.
Suppose the spectrum of the Cherenkov light follows 1/lambda^2,
The calculated total photo-electron number based on Chiba QE is 10.7% larger than that based on Hamamatsu one.
This difference corresponds to the systematic between these two.
From this analysis we decided to use Hamamatsu data for 2005 PMT instead of Chiba. (BTW: We are still tring to understand the QE difference between ours and Hamamatsu's.)
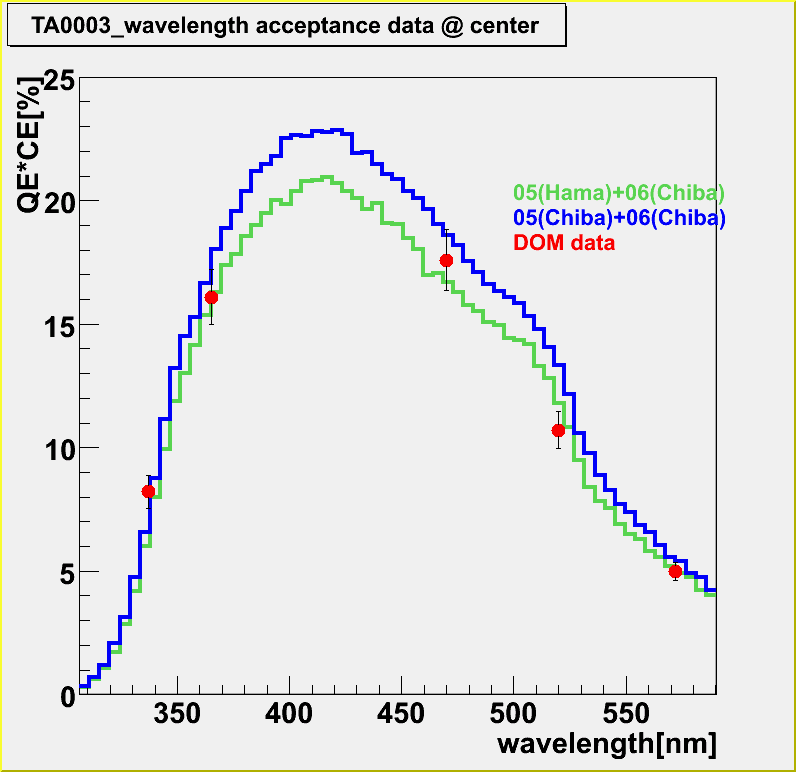
Fig4.comparison between Chiba and Hamamatsu
|
The detailed comparisons for each data point are summarized below table.
[Description of the table]
DOM data : DOM QE at each wavelength measured by Chiba.
sim -data[%] : absolute difference (subtraction of GDOM efficiency (data) from ROMEO simulation)
sim -data/data[%] : The ratio of data to simu-data
[diff]:The histogram of QE(sim-data)[%].
[0~168deg][180~348deg]: Figures of AbsoluteQE[%] vs distance on cathode for each azimuth axsis.
2D Map :
The left panel shows the simulation results by ROMEO and the middle panel shows the data
based on averaging the actual
GDOM calibration measurements (TA0003).
The right panel indicates the subtraction between the two.
Without correction
With correction :shift 4.48nm
We did the same analysis for each DOM.
The variance of each DOM was 10.1%.
*For details of comparison for each DOM see->Comparison for each DOM
The differnce between without correction of the wavelength shift and with the correction
Suppose the spectrum of the Cherenkov light follows 1/lambda^2,
we estimated the photo-electron number about two cases, 1) without correction of the wavelength shift and 2) with correction of 4.48 nm shift.
The total photo-electron number of 1) was 945472 and that of 2) was 974511.
As a result, the relative difference between 1) and 2) was 3.1% about average data.
This means that the shift 4.48nm is not effective .
The result is summarized in Fig5.
For the reference , the average PMT QE of Hamamatsu measurement is also plotted.
[Be careful: DOM QE is 15% less than PMT because it is not converted to 0p.e. threshold QE.(see Fig2)]
The case without wavelength shift correction gives the satisfactory agreement
between ROMEO and the actual DOM measurement for all GDOMs.
From DOM by DOM analysis, we found that the variance of each DOM was 10.1%.
The agreements gets worse in the DOM efficiency at the edge
of the PMT cathode surface. Moreover, the 1st dynode structure seen in
the bare PMT uniformity map does not appear in the DOM data although
ROMEO simulation predicts that the structure remains visible.
This may indicate that the Geant simulation is not enough correct to
account for our measurement.
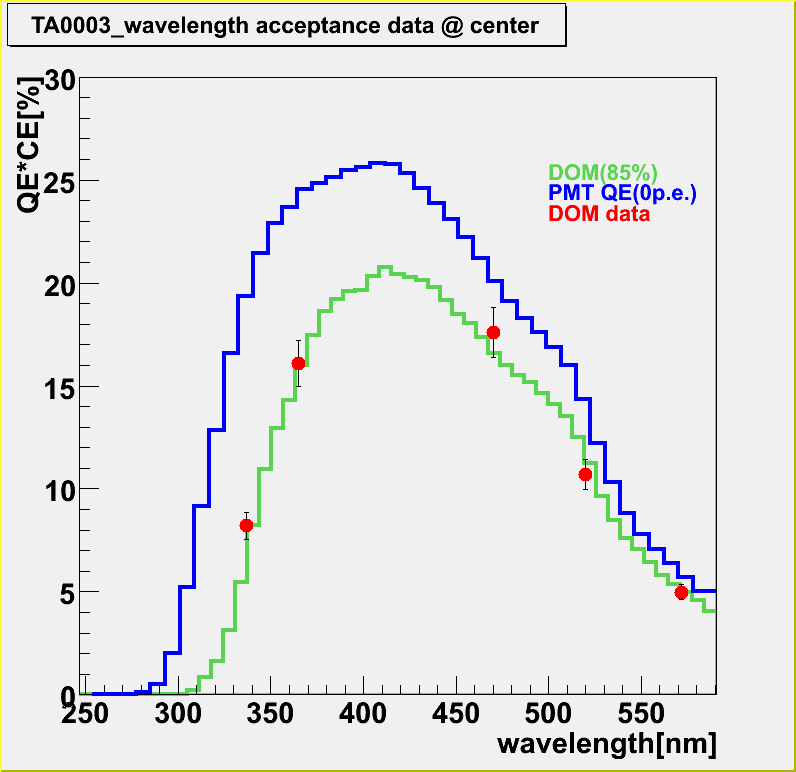
Fig5.final result
|
*For old analysis page ->Old page
Last modified: Thu August 04 13:44 JST 2007
mailto:mina@hepburn.s.chiba-u.ac.jp
back


