Implementation of results from the Golden PMT/DOM measurement to the IceCube simulation
back to Golden PMT page
Implementation of results from the Golden PMT/DOM measurement to the IceCube simulation
abstract
This page describes the use of GDOM calibration data in the "ROMEO", a package to simulate photon propagation through the DOM's GLASS/GEL and associated PMT responses.
We have a limited number of measured points in the actual Golden DOM calibration (in beam incident directions and
wavelength).
This requires us to study a way to interpolate/extrapolate these data points in order to simulate behaviors of photon other than the one measured. The results of this study is presented.
summary
The photon propagation in the glass and gel has been independently simulated
by the GEANT4 and the results are stored in the table form.
ROMEO reads the table and simulates PMT responses.
We consider that this part of the ROMEO simulation (or the uncertainties in the optical characteristics of gel) could be a source
of partial disagreement between the ROMEO and the DOM calibration data.
The study shows that a slight shift in the wavelength dependence of Glass/GEL acceptance values
used in the ROMEO results the good agreement between the simulation and the calibration measurements
at several wavelength points.
The relative systematic error after this correction is
approximately 5 % for most of the measured wavelengths,
although there appears a departure between the ROMEO prediction
and the actual acceptance measurement at the edge of the DOM sphere.
Contents
1. Golden PMT/DOM Data
2. Analysis method
3. Results
3.1 FY2005 Golden DOM Analysis
3.2 FY2006 Golden DOM Analysis
3.3 Average Golden DOM Analysis
4. Summary
The available data sets from the GOLDEN PMT/DOM calibration are following:
The first three data sets are obtained from the relative calibration.
The latter two are from our absolute calibration.
The year 2005 and 2006 absolute data sets are obtained for different
combinations of wavelengths because of the difference in the methods to do the absolute calibration:
| year |
PMT |
DOM |
| 2005 |
337nm |
337nm |
| 2006 |
337nm |
365nm,470nm,520nm,572nm |
*For details of GPMT/DOM Experiment, see->GPMT/DOM Experiment
*For details of GPMT/DOM calibration Results, see->GPMT/DOM Results
We consider that the differences in the ROMEO simulation and the DOM data
arise from our incomplete knowledges of the glass and gel transparency.
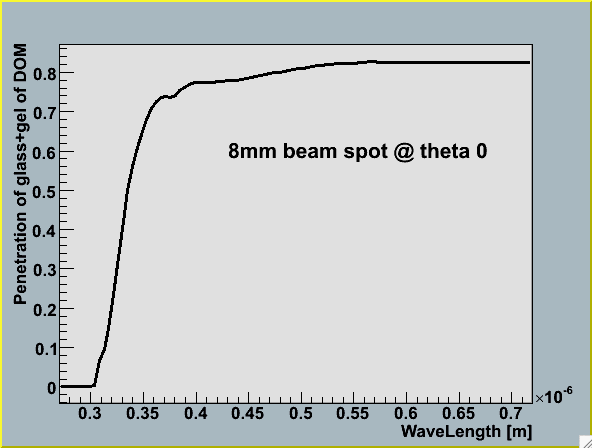
The figure below shows the photon penetration in glass+glass as a function of wavelength.
It shows that the sharp fall-off of the transmittance
starts at around 350 nm.
This indicates that a sizable change of the transparency can be introduced by even a tiny shift of wavelength and this effect makes the more systematic inconsistency between the simulation and the data in the short wavelength region.
In this study, we evaluate values of the wavelength shift in the glass+gel transmittance data such that ROMEO simulation reasonably describes the DOM calibration data.
 (Based on the measurement by Elisa R.)
Here, we search for the value of the wavelength shift to give the best agreement
between ROMEO and the data for 337 nm wavelength. Then the agreement at the other wavelengths
by the same correction recipe is evaluated.
This analysis is carried out by running ROMEO with the special configuration following the LED light profile
at the Chiba's DOM calibration.
The comparison between the simulation and the data
are made by looking the difference of the simulated and measured detection efficiencies
at various locations on the DOM sphere surface.
*For details of average Charge Response, see->Charge Response Analysis
*For details of PMT/DOM 2D sensitivity, see->PMT/DOM 2D sensitivity(Coming soon!)
Two cases have been studied with FY2005 data :
(1) using the Chiba's absolute bare PMT QE numbers
(2) using the Hamamatsu numbers
Note that the PMT QEs measured by Chiba-group are 15%~20% higher than
those measured by Hamamatsu.
(see-> FY2005 GDOM calibration page)
Using Hamamatsu QE with glass+gel acceptance in wavelength shift by -3.38nm
universally describes all the GDOM data reasonably well.
See FY2005 Golden DOM Analysis for detail of this analysis
The Chiba data and the Hamamatsu numbers are very consistent in 2006
(see->FY2006 Golden PMT/DOM calibration page).
We used the absolute PMT efficiency obtained by Chiba and applied the same correction
as the 2005 recipe (i.e. - 3.38 nm shift in the acceptance).
ROMEO simulation predicts higher detection efficiency than those suggested by the actual
measurement without applying this correction.
The same prescription of shifting wavelength by -3.38 nm as applied on 2005 data shows good agreement between data and simulation.
The "-3.38nm shift prescription" provides the solution again, except for TA2259.
See FY2006 Golden DOM Analysis for details of 2006 GDOM analysis
This study is to define the default values in ROMEO for the iceCube simulation chain.
We tried two cases :
1) average of 2005+2006 GPMT ,
2) average of all PMTs(2003~2006).
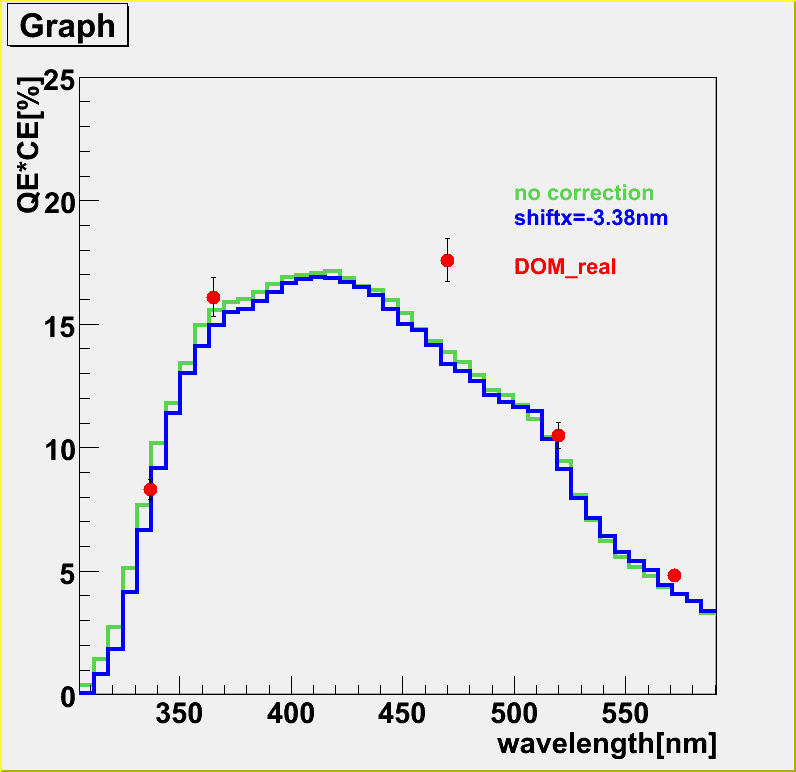
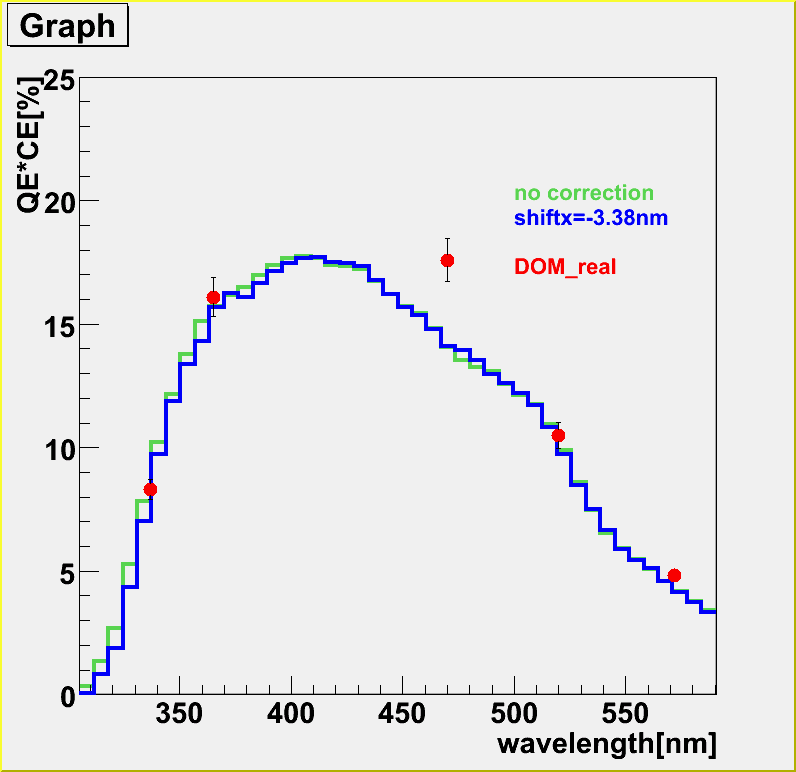
The wavelength dependence of the QE are shown in the figures below.
The left panel shows the case of 1) and the right one plots the case of 2).
DOM data(red point) are plotted on the histogram of the simulation.
Green curve corresponds to the case without any correction and blue curve to
the "- 3.38 nm wavelength shift" prescription. One can see that
DOM data is consistent with the blue curve
within the error, except for 470nm.


We will use the values obtained in this analysis with the wavelength shift recipe
for the default vales in ROMEO.
See Average Golden PMT/DOM for details.
The wavelength shift of
the glass + gel acceptance by 3.38 nm gives the satisfactory agreement
between ROMEO and the actual DOM measurement for all GDOMs.
This suggests that the earlier discrepancy in the ROMEO simulation and the calibration data could be due to
the uncertainties in the optical characteristics of gel, especially at wavelengths shorter than 350 nm where the sharp fall-off behavior.
The universal "3.38 nm" wavelength shift in the gel+glass transmittance table
for all the DOMs indicates that a DOM-by-DOM difference is mainly
governed by differences of the each PMT performances.
The agreements gets worse in the DOM efficiency at the edge region
of the PMT cathode surface. Moreover, the 1st dynode structure seen in
the bare PMT uniformity map does not appear in the DOM data although
ROMEO simulation predicts that the structure remains visible.
We should also remark that there are one GDOM (TA2259-"BakeNeko")
that shows still sizable discrepancy with the present correction.
It requires further investigations on photon propagation in the gel
to solve these minor, but possibly important issues, as our understanding
of the poler ice property becomes further improved.


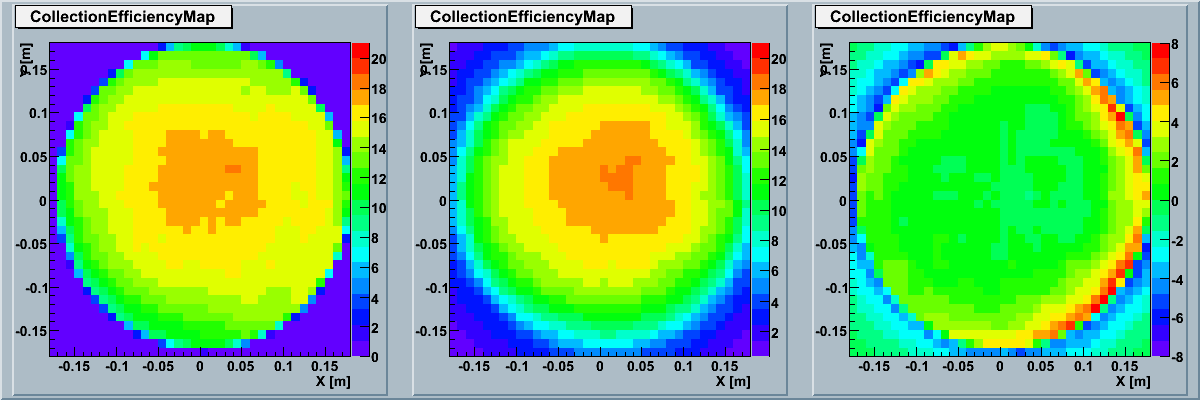
Figure:
The two dimensional photon absolute detection efficiency map of
the hypothetical "average" DOMs for 365 nm wavelength. The left panel shows the simulation results
by ROMEO and the middle panel shows the data based on averaging the actual
GDOM calibration measurements. The right panel indicates the subtraction
between the two.
Last modified: Mon June 14 13:42 JST 2007
mailto:mina@hepburn.s.chiba-u.ac.jp
back

 (Based on the measurement by Elisa R.)
